Skip to content

Ahmed-walid/PolyPlot

Folders and files

NameName
Last commit message
Last commit date

Latest commit


History

9 Commits


Repository files navigation

📉 PolyPlot

PolyPlot is a polynomial function plotter using Python and Tkinter.

User can enter any polynomial function and minimum value of x and maximum value of x.

image

How to use:

Environment setup:

  1. Install Python (+3.6.0).
  2. Run the following commands:
    • pip install numpy
    • pip install matplotlib
    • pip install tk
  3. Finally, run python .\PolyPlot.py

How to test:

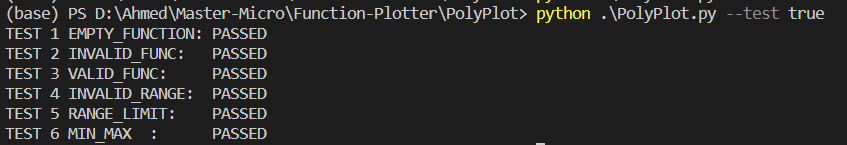
Run the following command python .\PolyPlot.py --test true

Examples:

1️⃣ First Order Function:

F(x) = x + 3 when x ranges from 0 to 5

image

2️⃣ Second Order Function:

F(x) = x2 + x when x ranges from 100 to 10000

image

3️⃣ Third Order Function:

F(x) = 15x3 - 7x2 + x -114 when x ranges from -200 to 200

image

💣 Errors and popup messages:

image image image image

Tests:

image

About

Function-Plotter

Resources

License

Stars

Watchers

Forks

Releases

No releases published

Packages

No packages published

Languages