This a Zabbix helm chart that will be used to monitoring infrastructures.
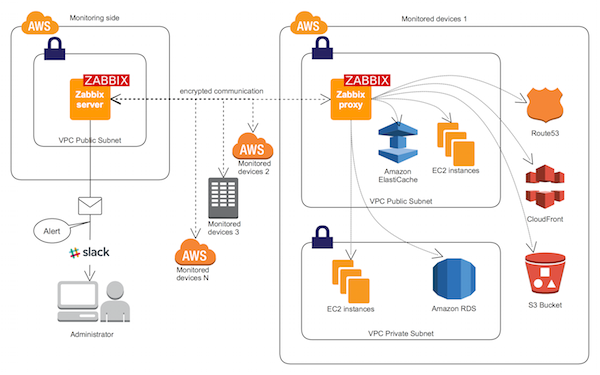
Zabbix server is the central component to which agents report availability and integrity information and statistics. The server is the central repository in which all configuration, statistical and operational data are stored.
All configuration information as well as the data gathered by Zabbix is stored in a database. In our case, we are using PostgreSQL as a database.
For an easy access to Zabbix from anywhere and from any platform, the web-based interface is provided. The interface is part of Zabbix server, and usually (but not necessarily) runs on the same physical machine as the one running the server.
Zabbix proxy can collect performance and availability data on behalf of Zabbix server. A proxy is an optional part of Zabbix deployment; however, it may be very beneficial to distribute the load of a single Zabbix server.
Zabbix agents are deployed on monitoring targets to actively monitor local resources and applications and report the gathered data to Zabbix server.
In addition it is important to take a step back and have a look at the overall data flow within Zabbix. In order to create an item that gathers data you must first create a host. Moving to the other end of the Zabbix spectrum you must first have an item to create a trigger. You must have a trigger to create an action. Thus if you want to receive an alert that your CPU load is too high on Server X you must first create a host entry for Server X followed by an item for monitoring its CPU, then a trigger which activates if the CPU is too high, followed by an action which sends you an email. While that may seem like a lot of steps, with the use of templating it really isn't. However, due to this design it is possible to create a very flexible setup.
You should already have an installed and configured postgresql on your node.
To install this chart you should follow these steps:
- Create a namespace using the following command:
kubectl create ns monitoring- Create postgresql secrets that will be used by
zabbix-webas well aszabbix-server, it should be something like this:
apiVersion: v1
kind: Secret
metadata:
  name: postgresql-secret
  namespace: database
data:
postgres-password: "UG9zdGdSZXMyTWU="- Install the chart by running the following command:
helm install zabbix zabbix-helm-chart -f zabbix-helm-chart/values.yaml -n monitoring- Access the web interface by running this command (replace the interpolation by its actual value):
kubectl port-forward {zabbix-web-server} 8888:8080 -n monitoring