Performance
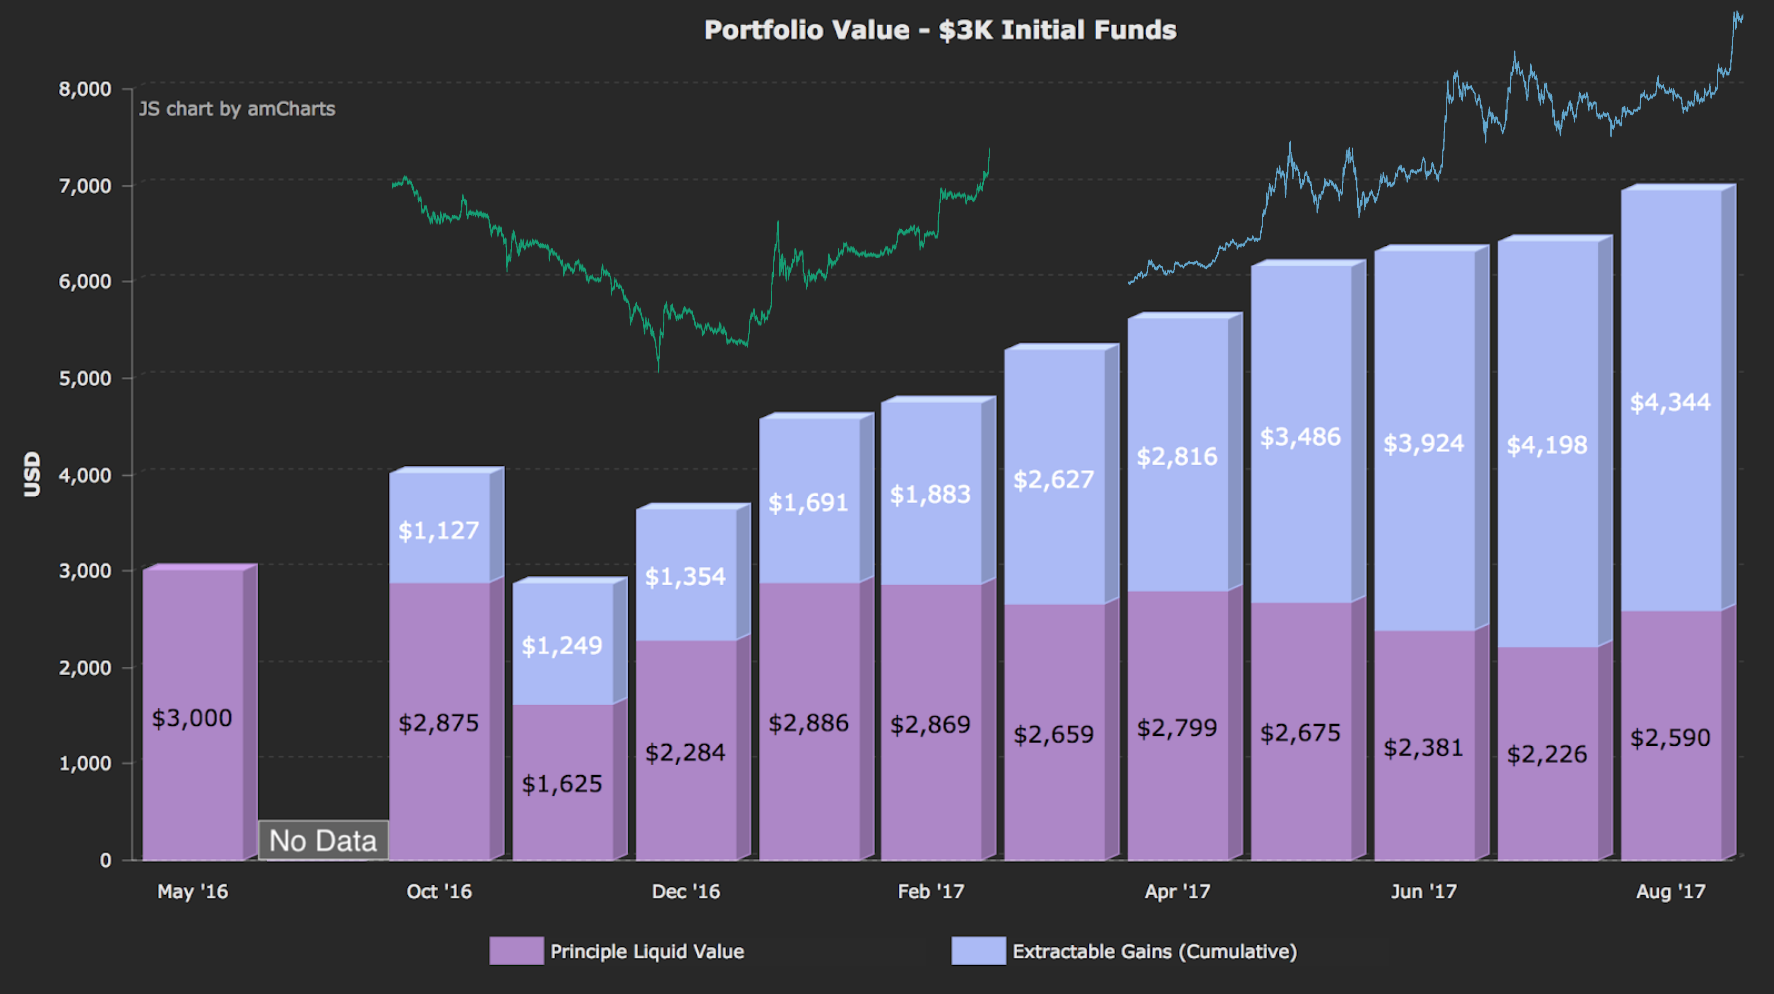
- For the time period of the charts below, the cumulative profit from flipped trades ('Extractable Gains') was always given to the trader, i.e., none of it was withdrawn/pocketed.
- Prior to Oct '16 BlueCollar did not have persisted metrics. The last known value of total PV where there were no open positions and the trader had full access to the funds was $3K in May. That figure is used as the initial funds.
- In Mar '17 $5K out-of-pocket funds were added to the trading account. This about doubled total PV at the time bringing it to $10,309, and it brought the total funds given to the trader to $8K. At the time of the addition there were no open positions and BlueCollar had access to all the funds.
- May '16 - mid-Apr '17 BlueCollar traded ETH.
- mid-Apr '17 - Aug '17 BlueCollar traded LTC.
- Oct '16 to mid-December '16: a 50% drop in ETH is in that time frame.
Prior to implementing metrics I would periodically take mental notes on how the trader was doing and how it was behaving. Much of what I understood about it was through observation, and it wasn't uncommon for me to periodically drop the database without a backup. When I introduced metrics recording, I wanted to get a better historical sense of the following.
- To what degree were the funds available for trading being protected?
- To what degree were extractable gains being generated?
- What was happening to the the market value of the initial funds over time? That is, PV without extractable gains; what I'll call 'Principal Liquid Value'. I knew it could never be higher than the total amount of funds given to the trader, but I wondered how much it flexed.
I defined those 'buckets' as follows:
total_pv = fiat_bal + mkt_val_held_coins + mkt_val_pending_sells + cost_of_pending_buy
extractable_gains = cumulative_profits_from_flipped_trades
principle_liquid_value = total_pv - extractable_gains
tradable_funds = fiat_bal - hoarded_gains
Chart Notes
- Jan, Apr, May, Aug of 2017: Extractable gains 'de-hoarded' (past gains are put at risk).
- Mar '17: the increase is influenced by a $5K injection.
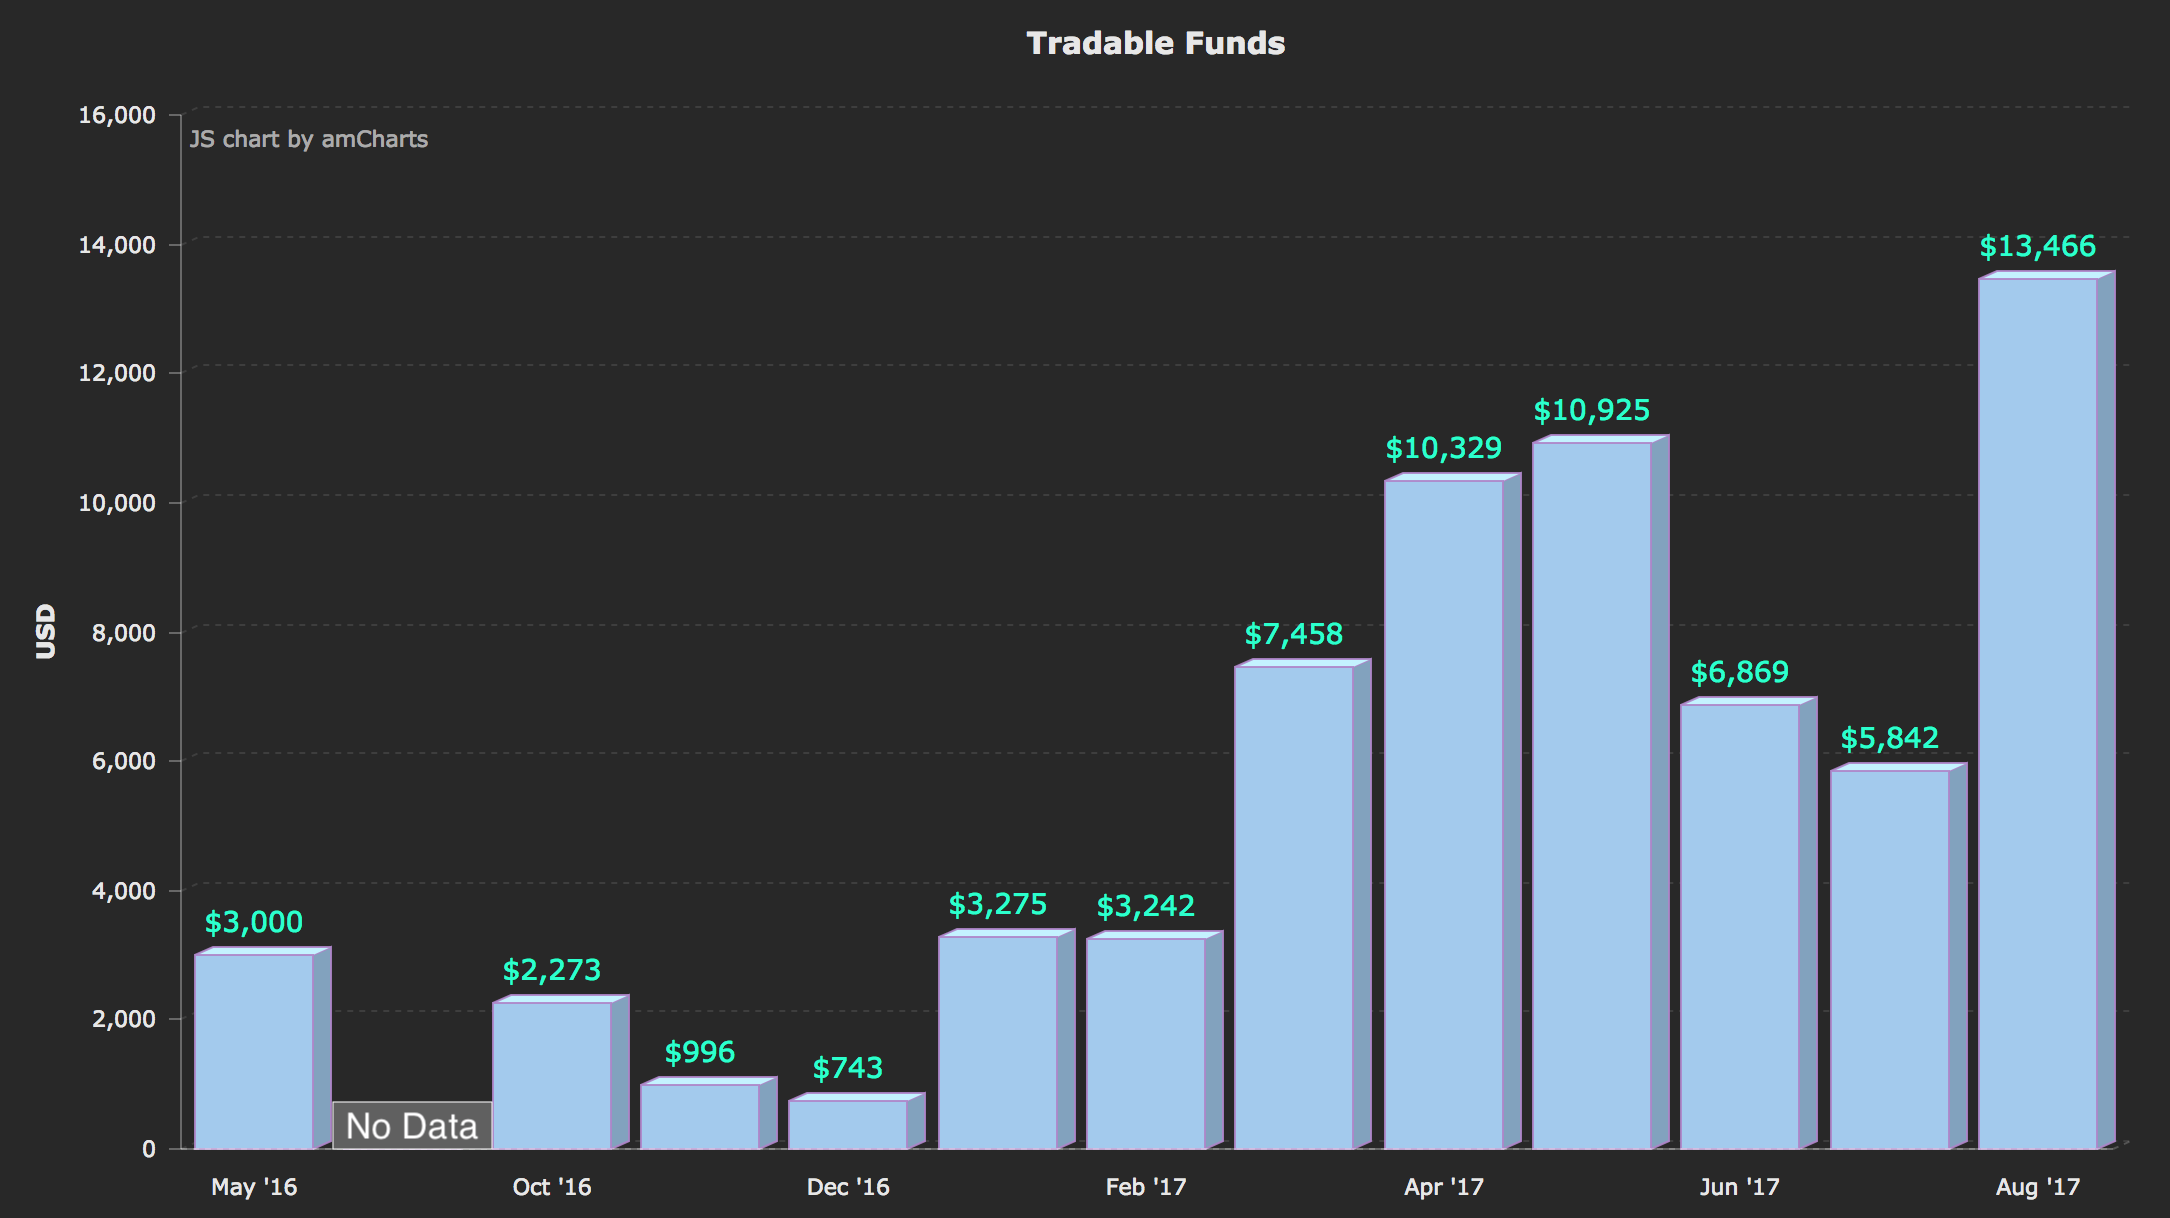
The chart above contains the end of each month's values for fiat balance in the trading account less hoarded gains. The figures reflect how BlueCollar stretches funds so it can continue to viably trade throughout the ups and downs. Tradable funds experience significant drops, which is to be expected, as BlueCollar buys the dip. Conversely, this figure goes up as sell orders execute and when extractable gains are de-hoarded.
If there are no open positions, and all funds are de-hoarded, this figure will equal total PV. Which is to say PV is comprised of only a cash position.
Chart Notes
- Mar '17 - $5K out of pocket added to the trader.
- Aug '17: 6 months after $5K added, PLV is 93% of out-of-pocket.
- Aug '17: 6 months after $5K added, Extractable Gains are 75% of out-of-pocket.
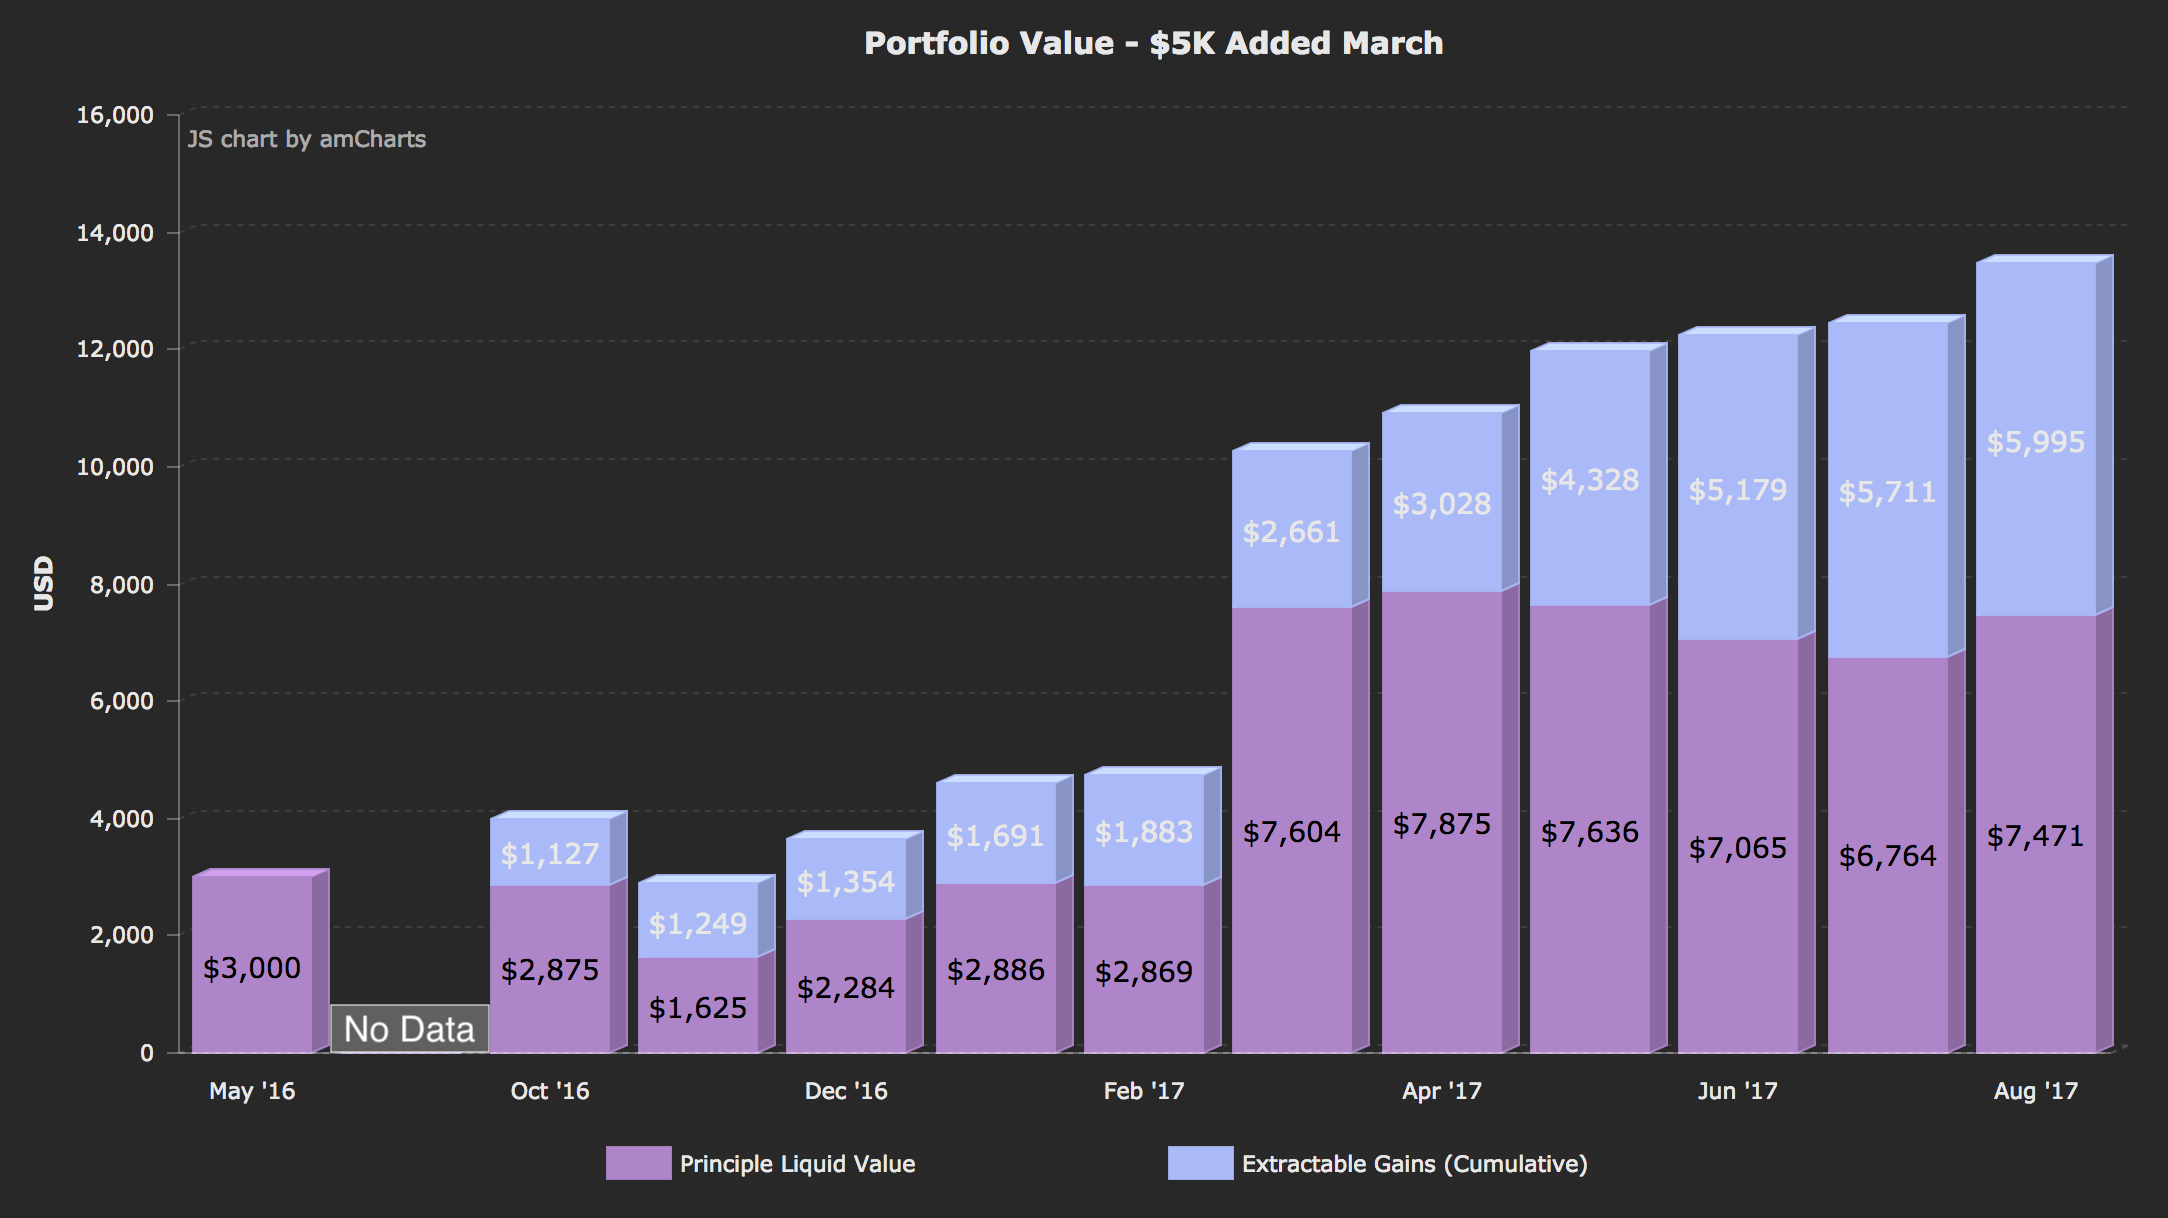
Extractable gains are the cumulative profit from flipped trades whether they were ultimately de-hoarded or not. Add up all the little profits from sell orders over some period of time and that's this figure. This amount is also what taxes are due on.
Principle Liquid Value (PLV) gave me a different perspective on how the protection mechanism was doing than the balance of tradable funds did, as PLV is inclusive of the market value of non-cash positions. December '16 is pretty bleak in terms of tradable funds, but not all that concerning for PLV. In fact if I would have liquidated then, PLV combined with extractable gains would still be net positive from May.
Though it is essential to performance that tradable funds get stretched adequately, I consider PLV relative to the total funds given to the trader more insightful regarding protection. Since BlueCollar is trading in a managed way, metrics associated with the sells it places during downturns are also part of the answer to how it's doing.
Chart Notes
- May '17: 'Zero risk exposure' point reached. Extractable gains exceed initial funds.
- Aug '17: After 1 1/4 years, PLV is still 86% of initial funds.
- Aug '17: After 1 1/4 years, Extractable Gains are 145% of initial funds.
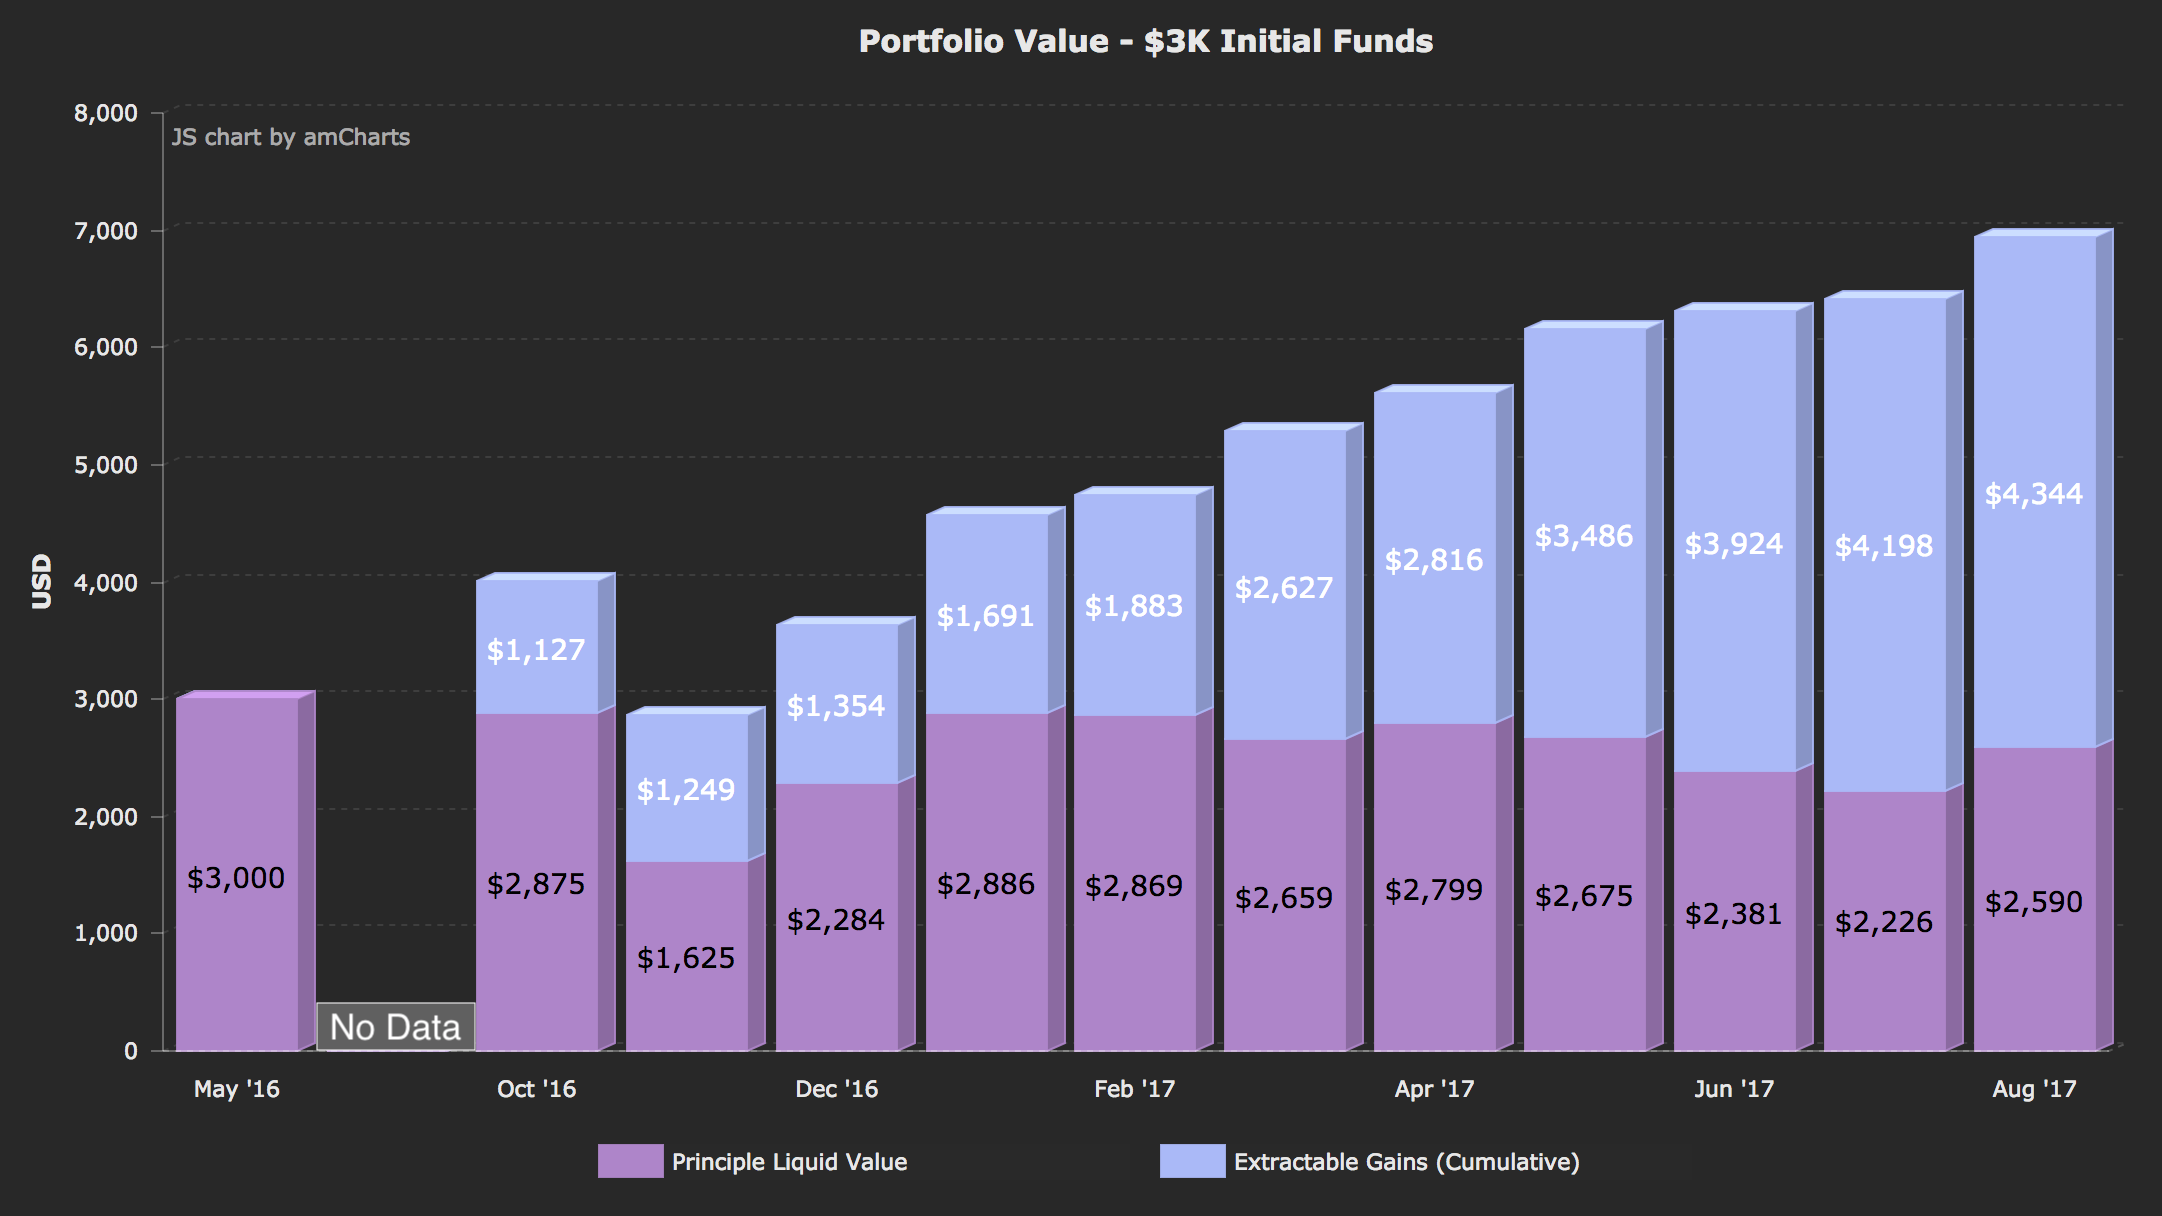
In March of 2017 I gave BlueCollar $5K more in funding out-of-pocket. This meant I wouldn't definitively know how long it took for extractable gains to equal initial funds given. This is a metric of high interest to me, but it is best measured when funds aren't added, as that impacts performance in a way that can sometimes be greater than 1:1. Previously it took about a year for BlueCollar to turn $1.5K into $3K and no funds were added then, but that was a different market. The chart above is adjusted monthly for March thru August to reflect performance as if the $5K was not added. PVL and Extractable Gains were multiplied by an offset factor.
offset_factor = total_pv_pre_added_funds / total_pv_post_added_funds
The calculation here is akin to a managed fund where the initial contributors share ($3K) would be need to be tallied/offset after another contributor joined.
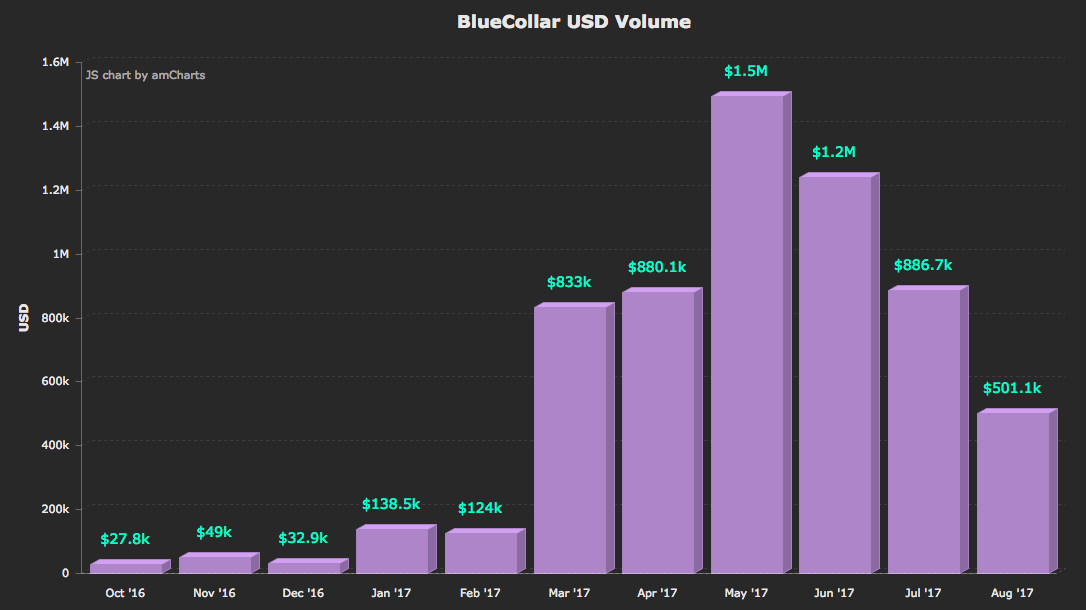
The spikes in volume beginning in March are in part due to the $5K injection but also from switching to trading LTC. ETH was ~$50 when the switch occurred and LTC was ~$15. All other factors being equal, a lower price results in a higher per trade USD volume through the protection calculation. So even if the frequency of trading is the same, USD volume will increase. The other side of this coin can be seen from May '17 onward as the price of LTC reaches ~$50 and volume expectedly declines.
Compared to what BlueCollar has to leverage I found the volume it does to be surprising. Sometime in June of 2016 I checked my 30-day rolling volume on GDAX and BlueCollar had accounted for 1% of all ETH trading. Granted, overall exchange volume at that time was pretty low and ETH was cheap. With a total of $8K given to the trader, the total volume in the chart above is $6.2M.
What isn't completely obvious here is that BlueCollar is executing a high number of trades to get that volume. This is significant because the IRS expects a per transaction level of detail with regard to crypto. That means every trade executed will need to be reported on Form 8949.
Chart Notes
- ETH price movements overlay in green
- LTC price movements overlay in blue
The price doesn't have to go up from where the trader started in order for extractable gains or (even total PV) to increase. PV declines associated with long-lived orphaned sells placed during downturns can be made up for in the longer-term by flipping profitable trades within market oscillations in lower price ranges. Of course rebounds accelerate this process.
Between Oct 20th and Jan 5th the price of ETH at one point had fallen about 50%, from $12.03 to $5.94. BlueCollar traded throughout the downturn and when the price came back up to $11.44 during an early January rebound, PV was up 8.8% from where it started, $4064 to $4422.
March is another good example (price movement not shown), where a the price of ETH fell ~40% before returning to a monthly high of ~$55 at the end. And again when trading LTC in May where volatility was high for the month. In August too there's a rebound to early July price level and a lot of volatility in between.
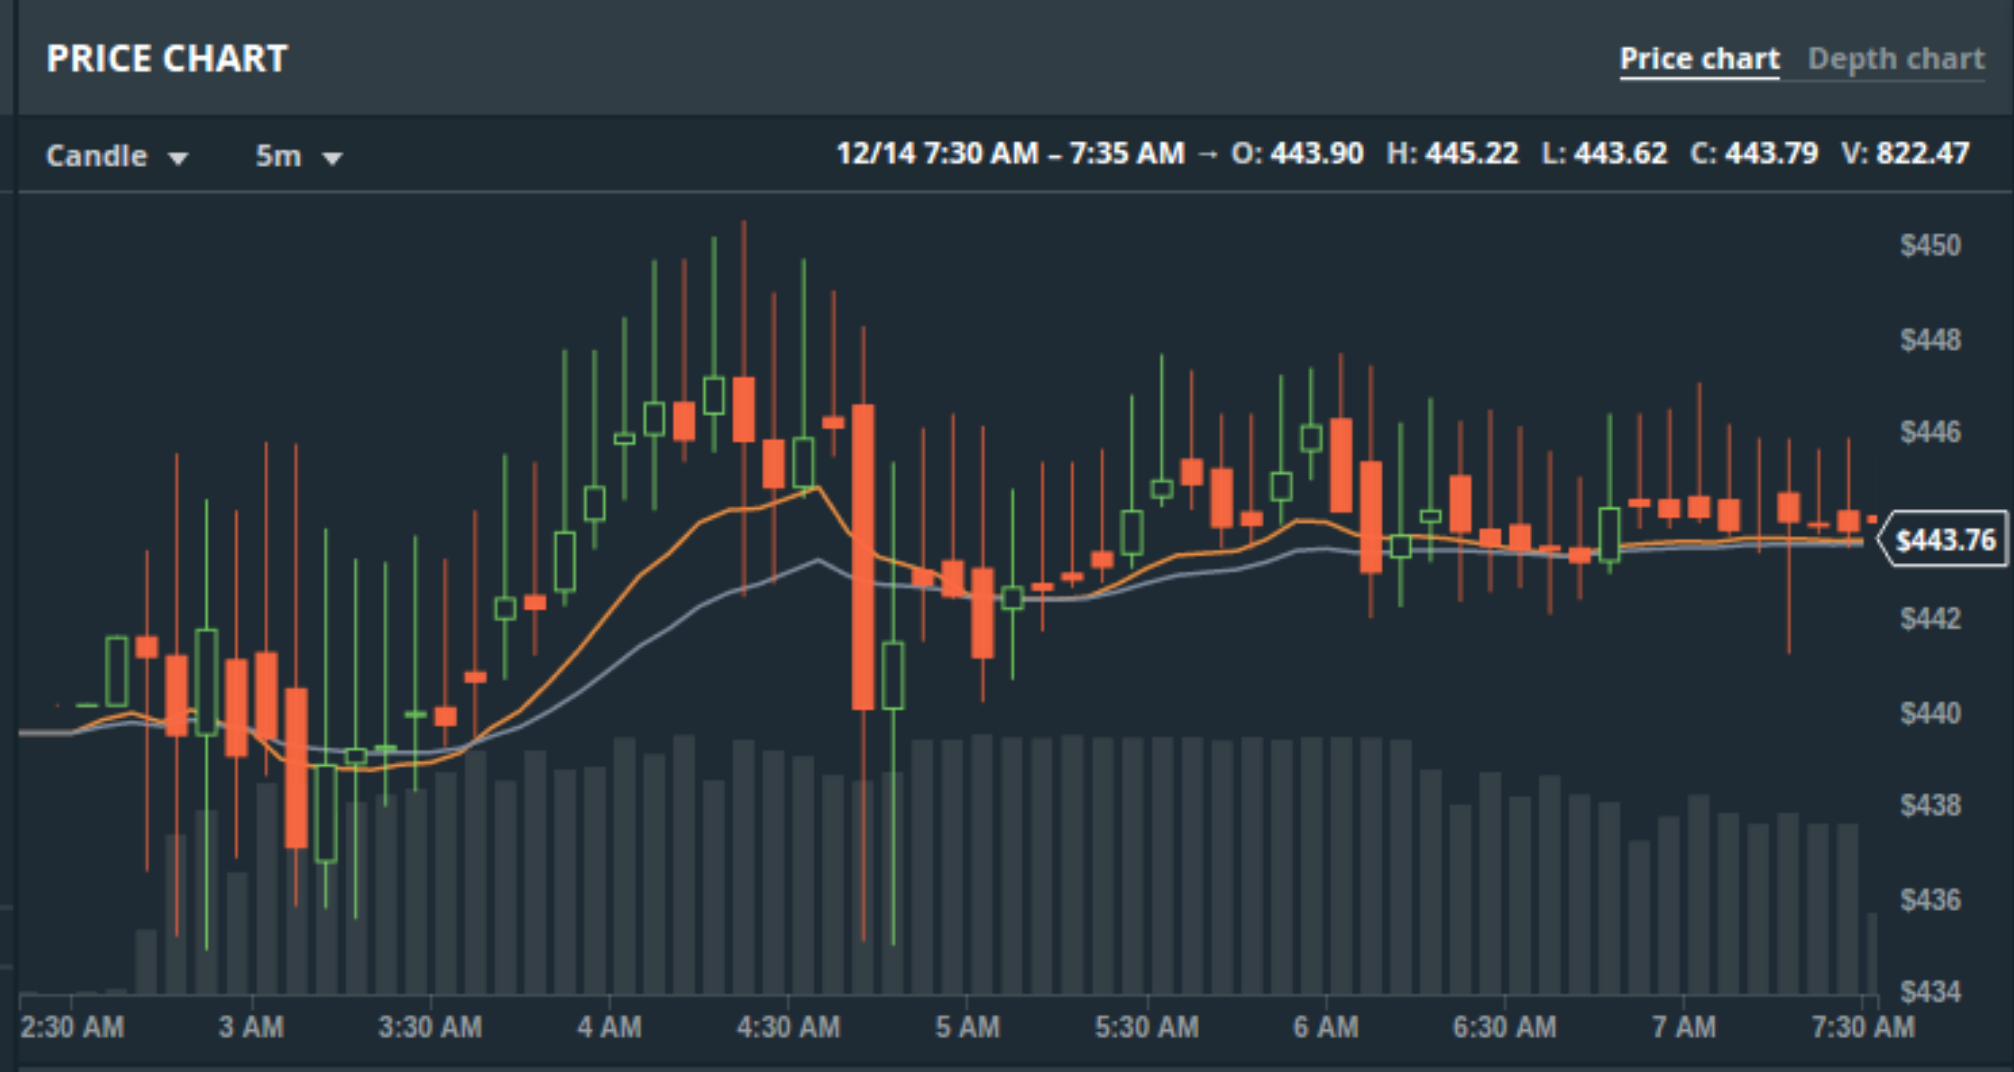
BlueCollar benefit most from high volatility where the bulk of extractable gains are made in price troughs and rebounds, as opposed to benefitting from price increases. Long wicks are especially good as dips and rebounds are occurring much more frequently, meaning more flipped trades. To mark the point with an extreme example, the chart below is somewhat of a "Goldilocks" scenario.
I was aware of this characteristic prior to implementing metrics. Previously BlueCollar got "priced out" of trading BTC. In mid-April of 2017 it was priced out of trading ETH. It was eventually priced out of trading LTC (currently I run an instance of BlueCollar specialized for another exchange where it trades XRP).
The performance decline is in part because at higher prices the per trade quantity is decreasing when protection recalculates, which results in smaller sell order profits at the set PI. Another factor is that all sell orders are regularly executing so BlueCollar is spending more time chasing price in scrums. Higher prices are more of an issue the smaller the amount of funds to trade with, which is unfortunate given the current prices of GDAX's available pairs.
BlueCollar's bread and butter is flipping trades, and it relies on market activity to do so. When that is lacking, performance suffers. The trader does better on higher volume exchanges.