This repository contains the code and data to reproduce some of the main results from the paper "Machine learning detection of dust impact signals observed by the Solar Orbiter", freely accessible at https://angeo.copernicus.org/articles/41/69/2023/angeo-41-69-2023.html
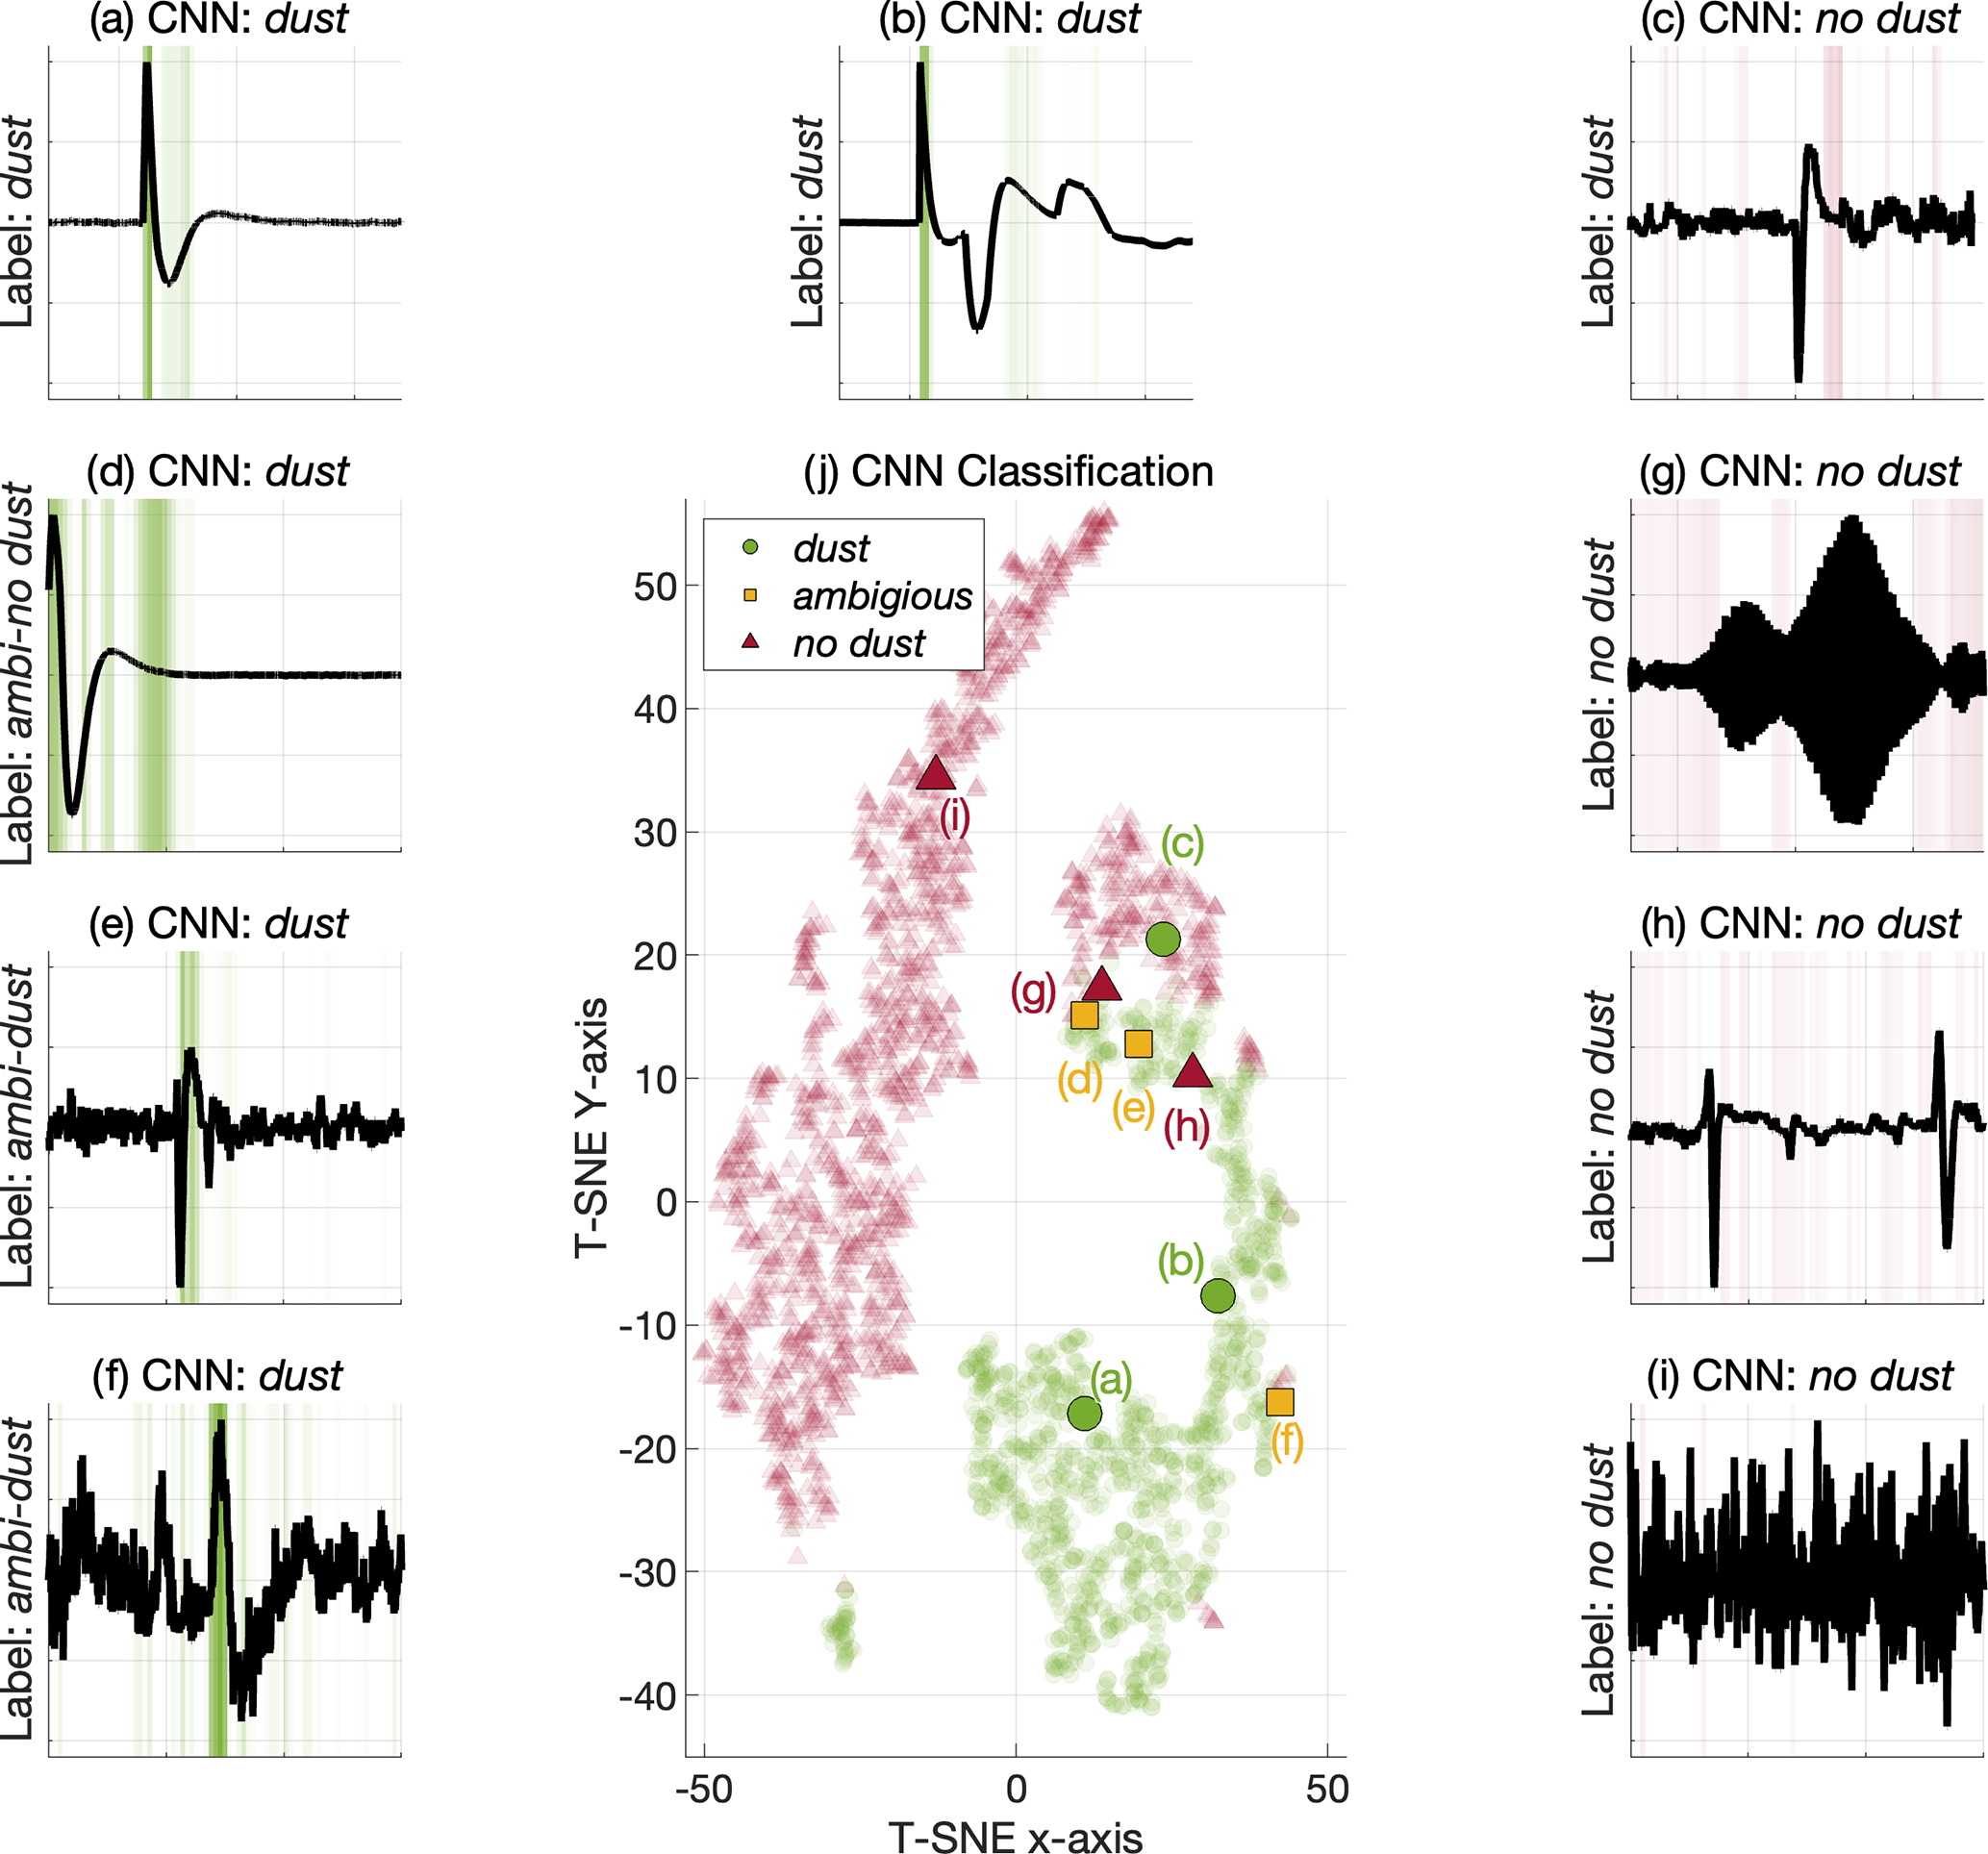
This article presents results from automatic detection of dust impact signals observed by the Solar Orbiter - Radio and Plasma Waves instrument.
A sharp and characteristic electric field signal is observed by the Radio and Plasma Waves instrument when a dust particle impacts the spacecraft at high velocity. In this way, ~5-20 dust impacts are daily detected as the Solar Orbiter travels through the interstellar medium. The dust distribution in the inner solar system is largely uncharted and statistical studies of the detected dust impacts will enhance our understanding of the role of dust in the solar system.
It is however challenging to automatically detect and separate dust signals from the plural of other signal shapes for two main reasons. Firstly, since the spacecraft charging causes variable shapes of the impact signals and secondly because electromagnetic waves (such as solitary waves) may induce resembling electric field signals.
In this article, we propose a novel machine learning-based framework for detection of dust impacts. We consider two different supervised machine learning approaches: the support vector machine classifier and the convolutional neural network classifier. Furthermore, we compare the performance of the machine learning classifiers to the currently used on-board classification algorithm and analyze one and a half year of Radio and Plasma Waves instrument data.
Overall, we conclude that classification of dust impact signals is a suitable task for supervised machine learning techniques. In particular, the convolutional neural network achieves a 96%
The proposed convolutional neural network classifier (or similar tools) should therefore be considered for post-processing of the electric field signals observed by the Solar Orbiter.
The scripts and functions in this repository can be used on you local machine by downloading a clone of this repository using:
git clone https://github.com/AndreasKvammen/ML_dust_detection.git
This requires:
- GitHub (for cloning the repository)
- Python, Jupyter and Tensorflow working together on your local machine (for Convolutional Neural Network (CNN) Classification). For this work, Python 3.10.9, Jupyter Lab 3.5.3 and Tensorflow 2.9.0 were used.
- MatLab - the results were produced using MatLab2022b (for Support Vector Machine (SVM) Classification, CNN Classification of Triggered Snapshot WaveForm (TSWF) data and Dust impact rates), including the additional function subplot_tight that can be downloaded at: https://www.mathworks.com/matlabcentral/fileexchange/30884-controllable-tight-subplot
The folder "Data_train_and_test" contains the training and testing data in .csv format:
- Test_data.csv - is the testing data with dimension (600 x 12288), 600 observations consisting of 12288 (3x4096) measurements - 4096 time steps observed at 3 antennas.
- Test_labels.csv - is the binary testing labels with dimension (600x1) where the values (1 = dust) and (0 = no dust)
- Train_data.csv - is the training data with dimension (2400x12288), 2400 observations consisting of 12288 (3x4096) measurements - 4096 time steps observed at 3 antennas.
- Train_labels.csv - is the binary training labels with dimension (2400x1) where the values (1 = dust) and (0 = no dust)
The folder "SVM_train_and_test" contains the MatLab code to train and test the Support Vector Machine (SVM) classifier. The folder contain the following files:
- extract_SVM_features.m - is the MatLab code to extract the 2D feature vector from the training and testing data.
- SVM_dust_detection.m - is the MatLab script to run the training and testing of the SVM, based on the extracted feature vectors.
- SVM_dust_detection.pdf - presents the MatLab code and resulting plots in pdf format
The SVM achieved a 94%± 1% average class-wise accuracy and a 90%± 3% precision, trained and tested over 10 runs with randomly selected training and testing data sets.
The folder "CNN_train_and_test" contains the JupyterLab (Tensorflow) code to train and test the Convolutional Neural Network (CNN) classifier, proposed for time series classification in Wang et al. (2017). The folder contains the following files:
- CNN_dust_detection.ipynb - Jupyter Notebook that import the training and testing data and runs the training and testing of the CNN classifier.
- run_GitHub.h5 - is the trained model in .h5 format
- model_run_GitHub - is a folder containing the trained model in .pb format
The CNN achieved a 96%± 1% overall classification accuracy and a 94%± 2% precision, trained and tested over 10 runs with randomly selected training and testing data sets.
The folder "CDF_file_classification" contains the trained CNN classifier and the MatLab code to classify the Triggered Snapshot WaveForm (TSWF) data product (.cdf files). A sample script and the needed functions are included in order to classify a sample (.cdf) file "solo_L2_rpw-tds-surv-tswf-e_20211004_V01.cdf". The folder contains the following files:
- model_run_GitHub - is a folder containing the trained model in .pb format
- solo_L2_rpw-tds-surv-tswf-e_20211004_V01.cdf - is a sample file containing all triggered waveforms from October 4th, 2021, downloaded from https://rpw.lesia.obspm.fr/roc/data/pub/solo/rpw/data/L2/tds_wf_e/
- cdf_CNN_classifier.m - is a MatLab script that automatically classifies the triggered waveforms, contained in file "solo_L2_rpw-tds-surv-tswf-e_20211004_V01.cdf", and plots the classification results using the trained CNN classifier in folder "model_run_GitHub"
- classify_file.m - is a MatLab function that classifies a .cdf file
- preprocess_cdf.m - is a MatLab function that imports the .cdf file and pre-process it for classification
- preprocess_signal.m - is a MatLab function that performs the 4-step pre-processing procedure
- cdf_CNN_classifier.pdf - presents the MatLab code and resulting plots in pdf format
The folder "Dust_impact_rates" contains the MatLab script and files to reproduce the daily dust impact rates (Figure 11 from the article)
- dust_impact_rates.m - is a MatLab script to read the daily dust count (classified by the TDS, SVM and CNN approach) and convert it to impact rates using the RPW-TDS duty cycle. The script plots the daily impact rates along with the associated fit using the dust flux model from Zaslavsky et al. (2021) with an included offset
- TDS_ddc.txt - is a table containing the date and the daily dust count using the TDS approach
- SVM_ddc.txt - is a table containing the date, the median of the daily dust count (using the SVM approach) and the standard deviation of the daily dust count (calculated using 10 different training/testing data splits)
- CNN_ddc.txt - is a table containing the date, the median of the daily dust count (using the CNN approach) and the standard deviation of the daily dust count (calculated using 10 different training/testing data splits)
- fits.csv - is a table containing the date, the RPW-TDS duty cycle and the TDS/SVM/CNN fit to data using the dust flux model from Zaslavsky et al. (2021) with an included offset
- dust_impact_rates.pdf - presents the MatLab code and resulting plots in pdf format
Please, consider citing the original paper if you are using this library in your research
@article{kvammen2023machine,
  author = {Kvammen, A. and Wickstr{\o}m, K. and Kociscak, S. and Vaverka, J. and Nouzak, L. and Zaslavsky, A. and Rackovic Babic, K. and Gjelsvik, A. and Pisa, D. and Soucek, J. and Mann, I.},
  title = {Machine learning detection of dust impact signals observed by the Solar Orbiter},
  journal = {Annales Geophysicae},
  volume = {41},
  year = {2023},
  number = {1},
  pages = {69--86},
  url = {https://angeo.copernicus.org/articles/41/69/2023/},
  doi = {10.5194/angeo-41-69-2023}
}
Wang, Z., Yan,W., and Oates, T.: Time series classification from scratch with deep neural networks: A strong baseline, in: 2017 International joint conference on neural networks (IJCNN), pp. 1578–1585, IEEE, 2017.
Zaslavsky, A., Mann, I., Soucek, J., Czechowski, A., Píša, D., Vaverka, J., Meyer-Vernet, N., Maksimovic, M., Lorfèvre, E., Issautier, K., et al.: First dust measurements with the Solar Orbiter Radio and Plasma Wave instrument, Astronomy & Astrophysics, 656, A30, 2021.