For each embedding described in the inference schema(s), Phoenix serves a embeddings troubleshooting view to help you identify areas of drift and performance degradation. Let's start with embedding drift.
The picture below shows a time series graph of the drift between two groups of vectors –- the primary (typically production) vectors and reference / baseline vectors. Phoenix uses euclidean distance as the primary measure of embedding drift and helps us identify times where your inference set is diverging from a given reference baseline.
{% hint style="info" %} Note that when you are troubleshooting search and retrieval using corpus inferences, the euclidean distance of your queries to your knowledge base vectors is presented as query distance {% endhint %}
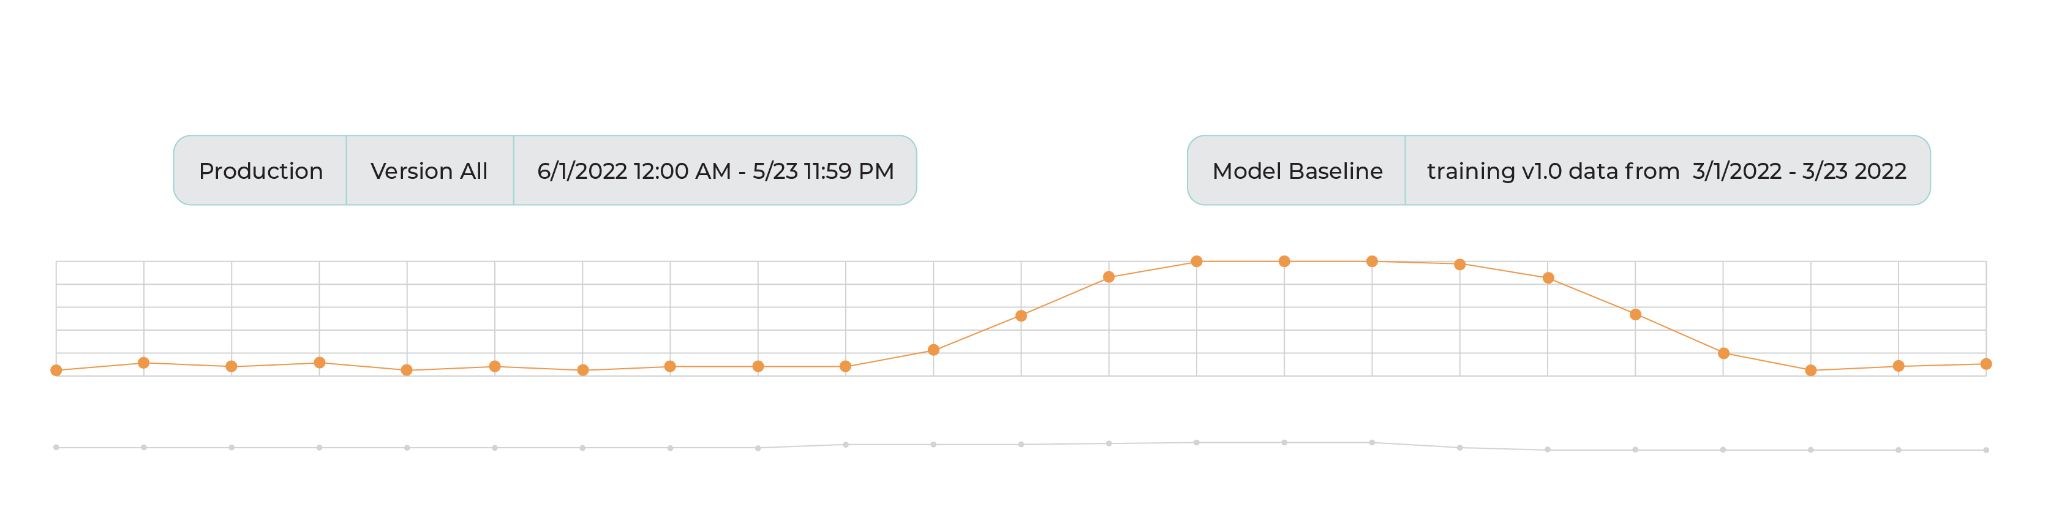
Euclidean distance over time
Moments of high euclidean distance is an indication that the primary inference set is starting to drift from the reference inference set. As the primary inferences move further away from the reference (both in angle and in magnitude), the euclidean distance increases as well. For this reason times of high euclidean distance are a good starting point for trying to identify new anomalies and areas of drift.
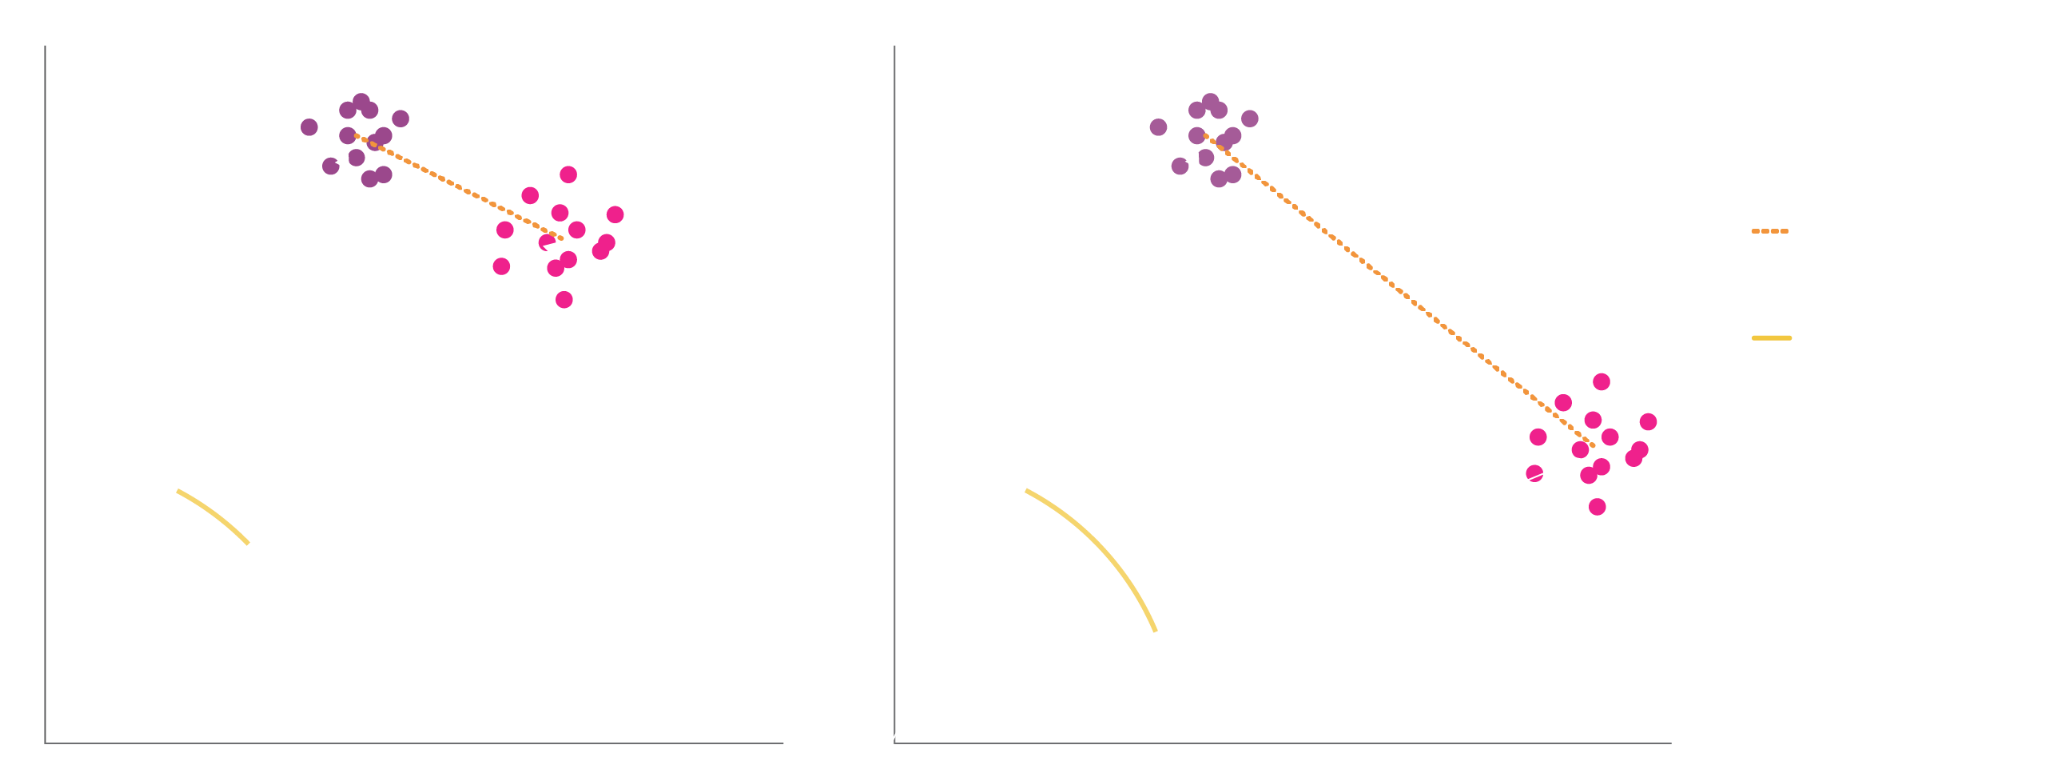
Centroids of the two inferences are used to calculate euclidean and cosine distance
{% hint style="info" %} For an in-depth guide of euclidean distance and embedding drift, check out Arze's ML course {% endhint %}
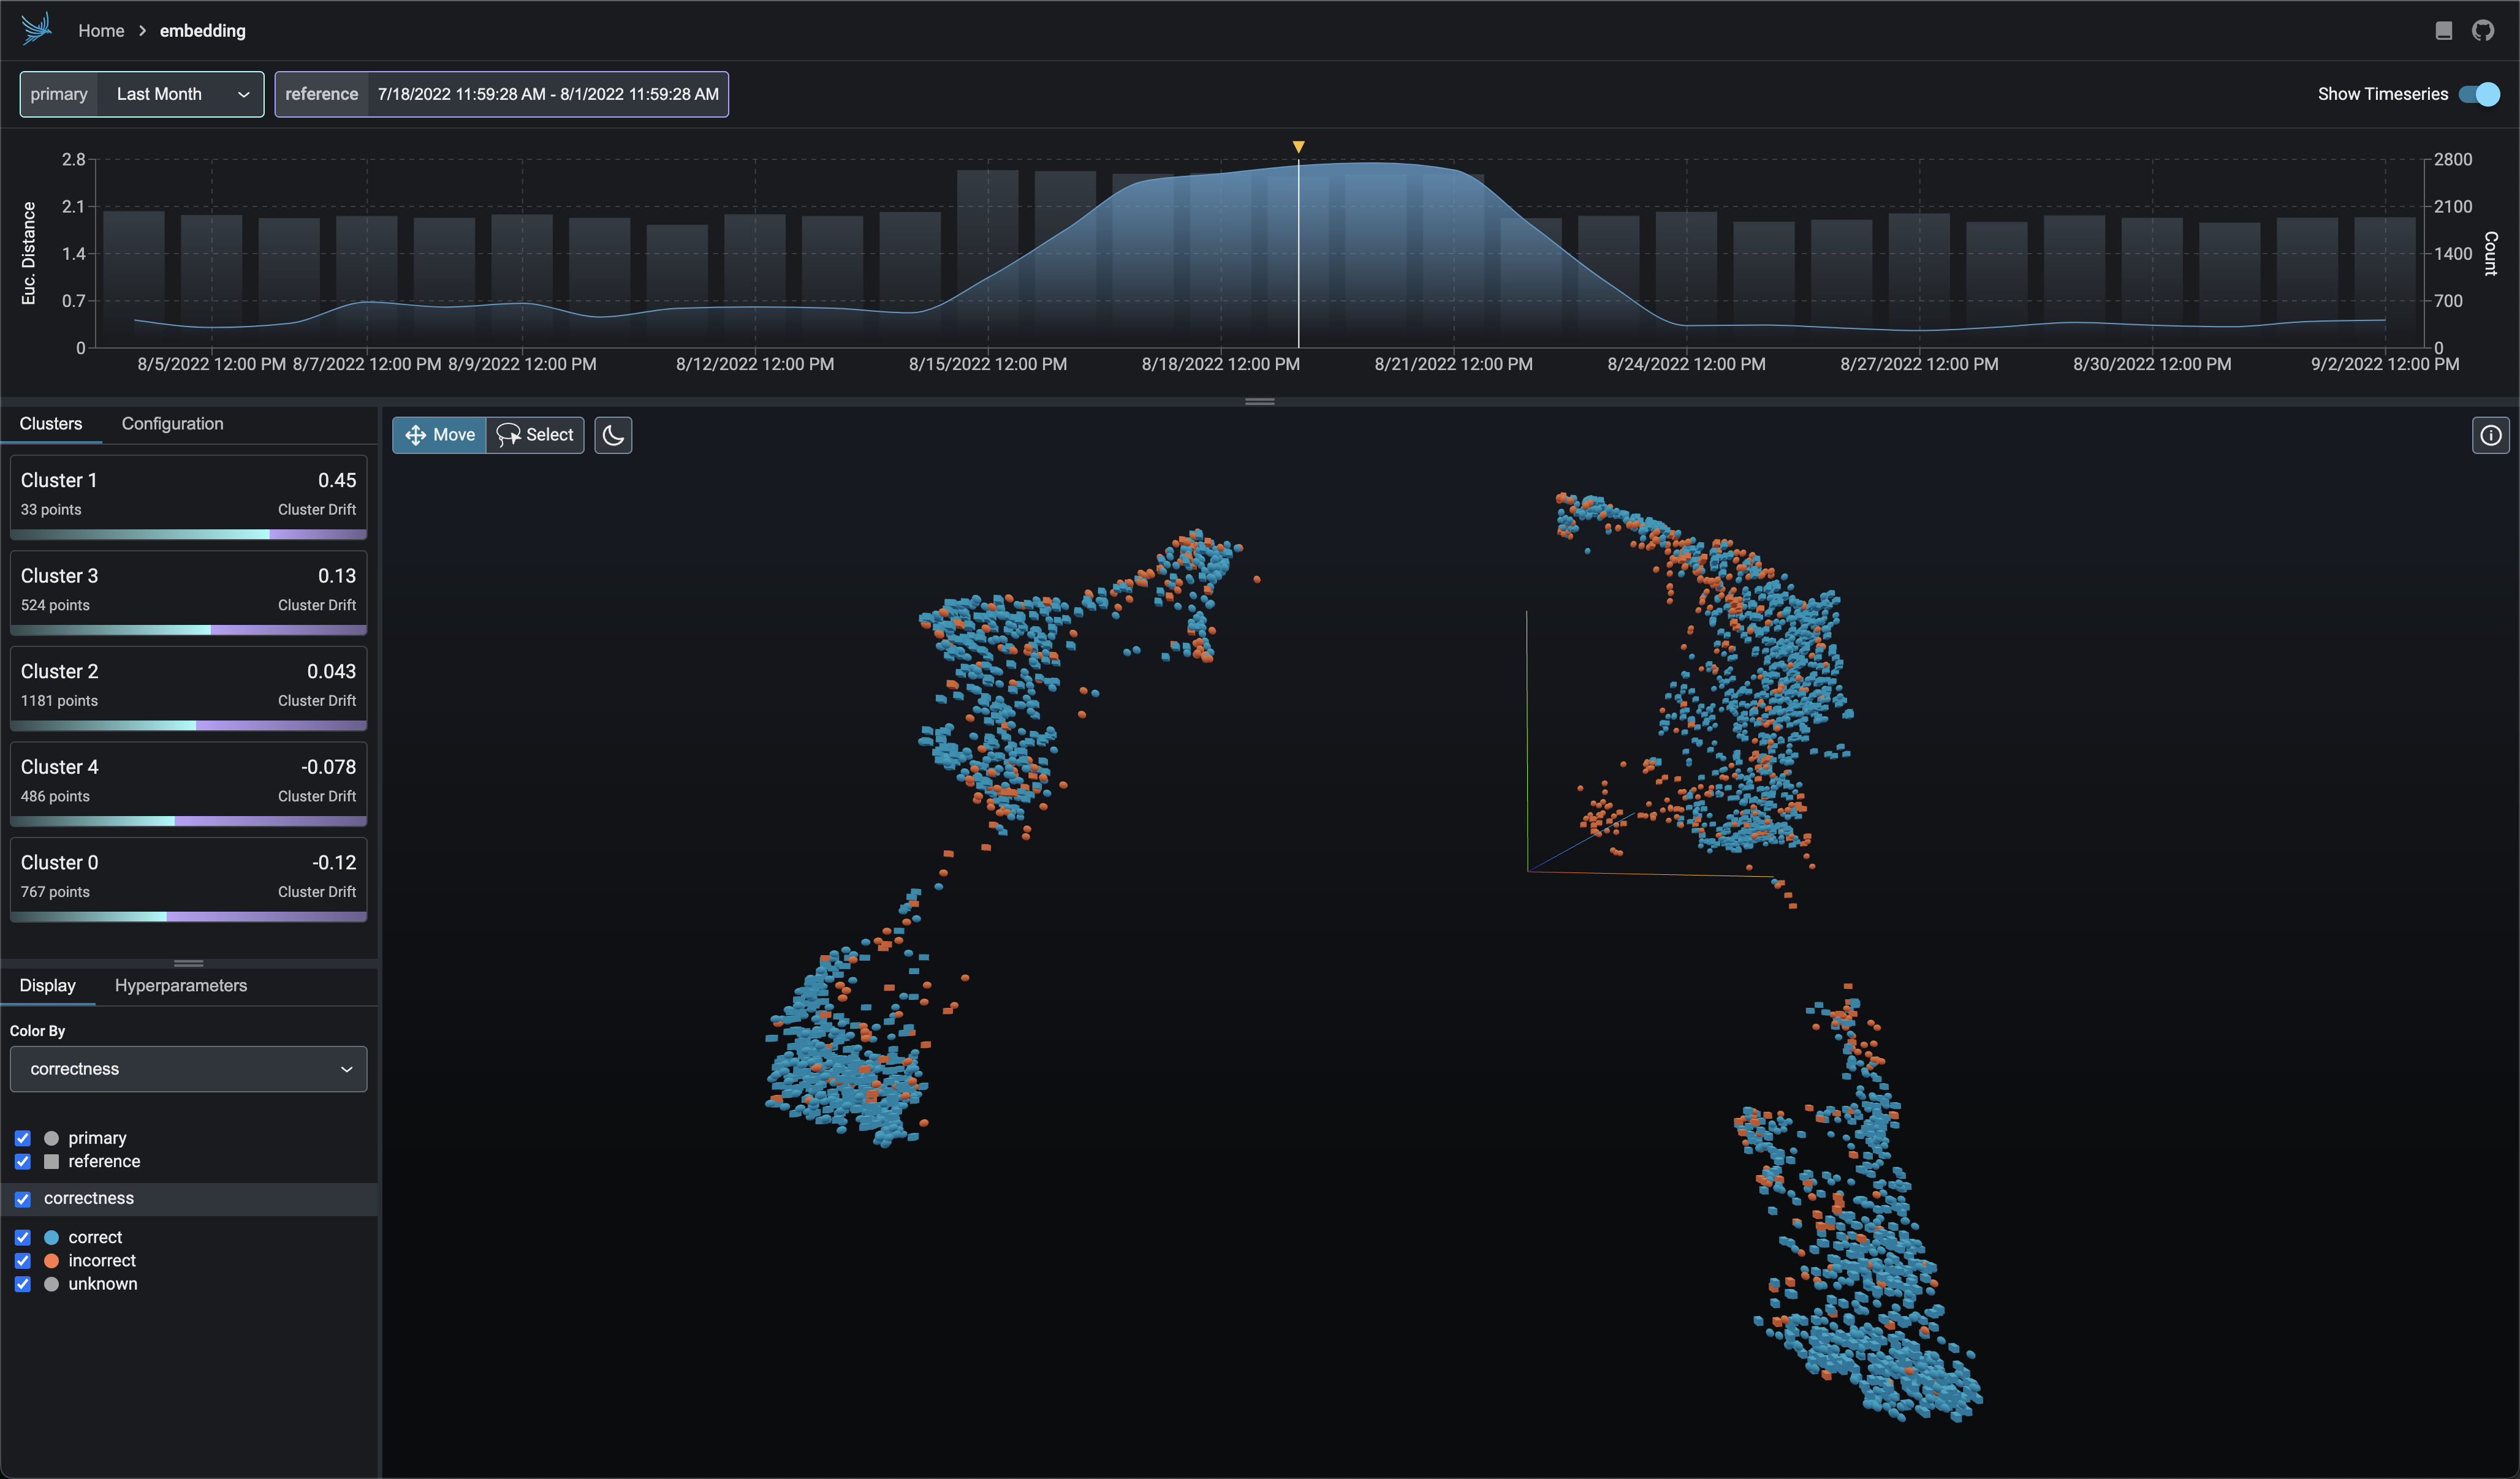
In Phoenix, you can views the drift of a particular embedding in a time series graph at the top of the page. To diagnose the cause of the drift, click on the graph at different times to view a breakdown of the embeddings at particular time.
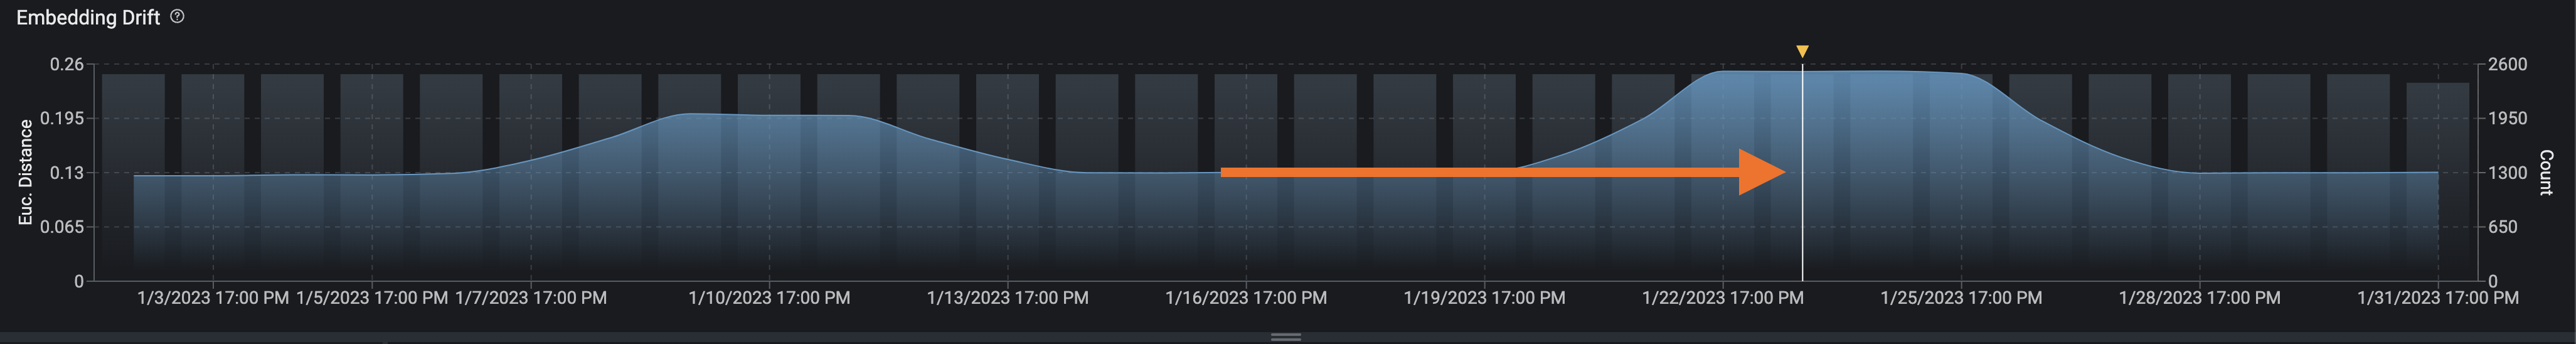
Click on a particular time to view why the inference embeddings are drifting
Phoenix automatically breaks up your embeddings into groups of inferences using a clustering algorithm called HDBSCAN. This is particularly useful if you are trying to identify areas of your embeddings that are drifting or performing badly.
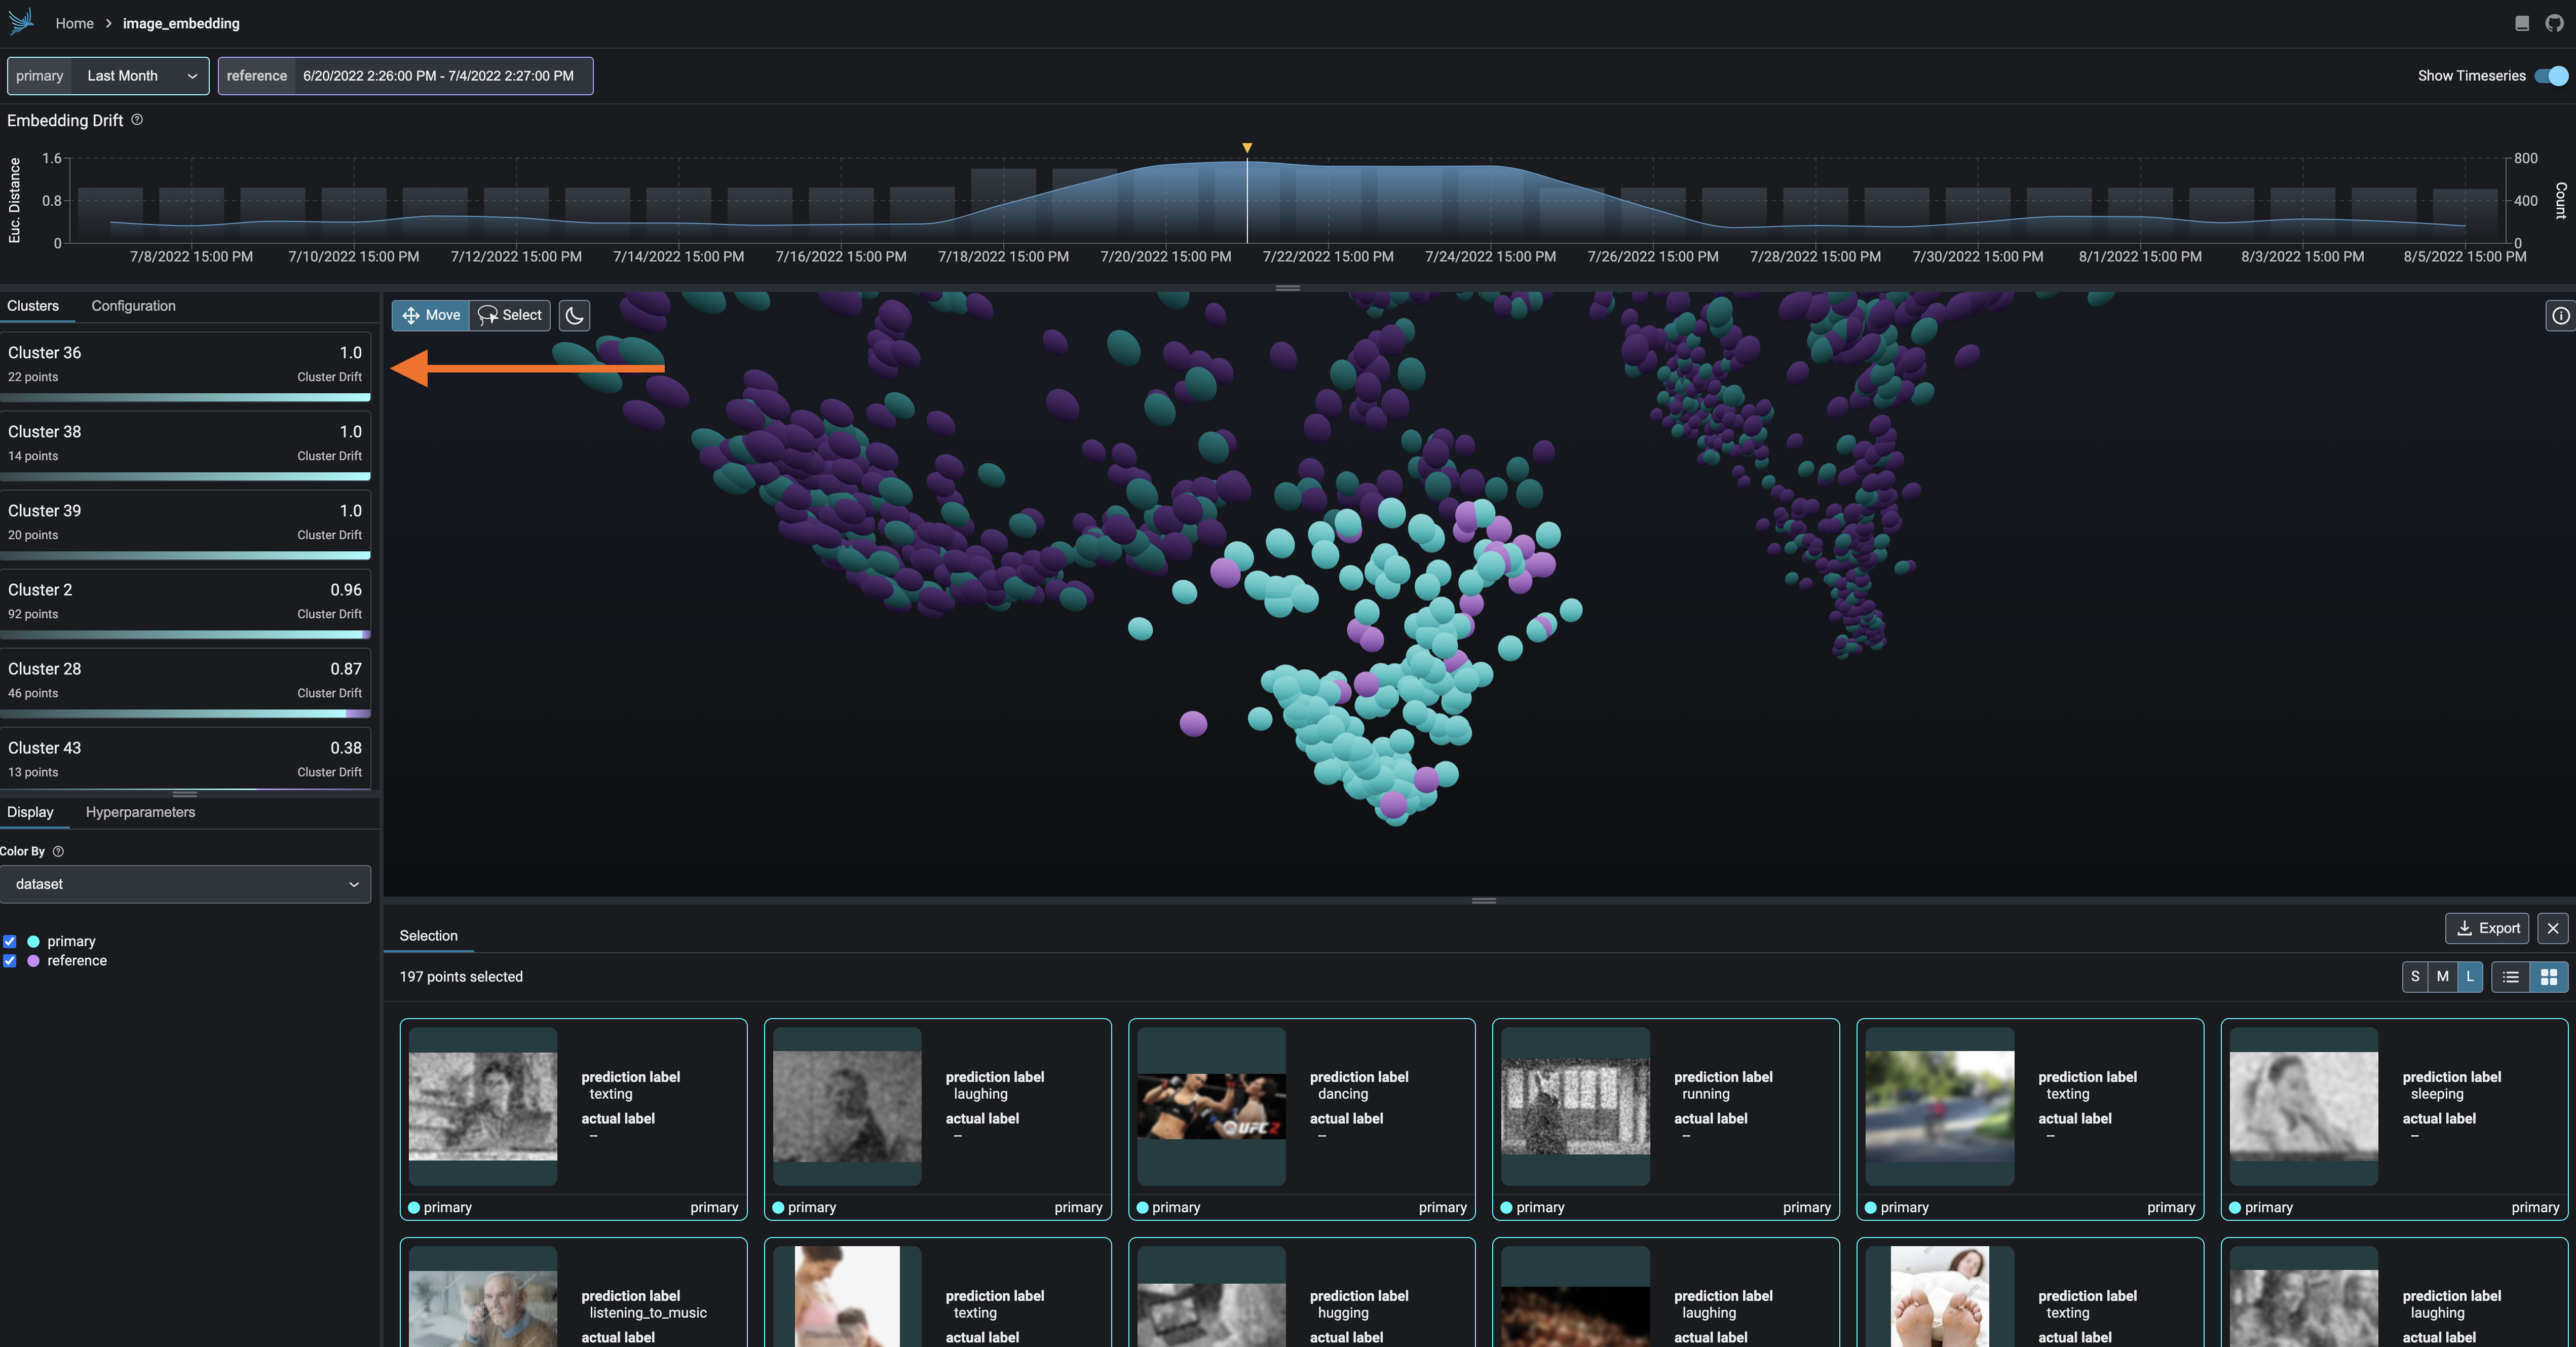
When twos are used to initialize phoenix, the clusters are automatically ordered by drift. This means that clusters that are suffering from the highest amount of under-sampling (more in the primary inferences than the reference) are bubbled to the top. You can click on these clusters to view the details of the points contained in each cluster.
Phoenix projects the embeddings you provided into lower dimensional space (3 dimensions) using a dimension reduction algorithm called UMAP (stands for Uniform Manifold Approximation and Projection). This lets us understand how your embeddings have encoded semantic meaning in a visually understandable way.
In addition to the point-cloud, another dimension we have at our disposal is color (and in some cases shape). Out of the box phoenix let's you assign colors to the UMAP point-cloud by dimension (features, tags, predictions, actuals), performance (correctness which distinguishes true positives and true negatives from the incorrect predictions), and inference (to highlight areas of drift). This helps you explore your point-cloud from different perspectives depending on what you are looking for.
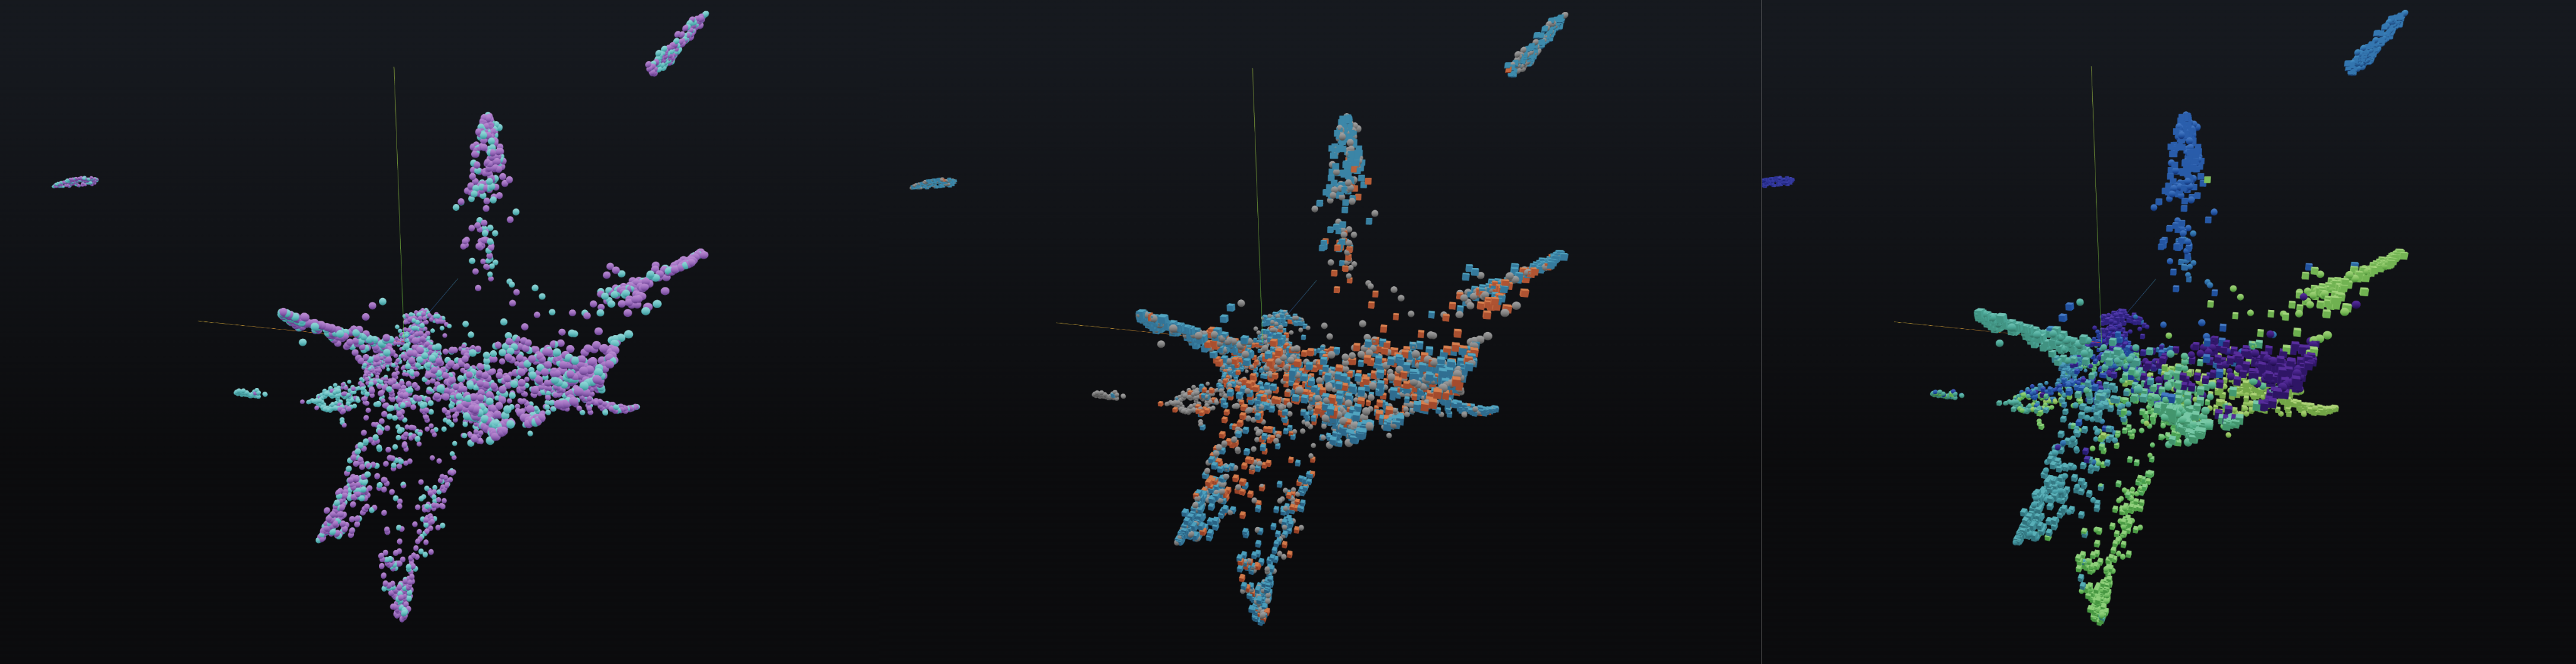
Color by inferences vs color by correctness vs color by prediction for a computer vision model