Raman and Micro-Photoluminescence (μPL) spectroscopy are powerful characterization technique providing many useful informations on the sample, they are non-destructives and have a spatial resolution around 100nm, which makes them widely used in nanoscience. This repository contains the source code to analyze raw measurements performed by Raman and μPL spectroscopy.
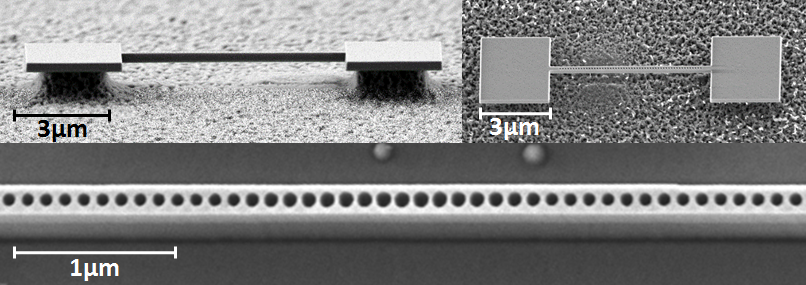
The samples used in our experiments are "nanobeam", it consist of a one dimensional photonic cristal for photons confinement and a quantum well for electrons confinement, both particles can be coupled to create a Quantum Electro Dynamic system, and our goal is to have a better understanding of the physical phenomenons involved in nanobeams by performing space and time dependent measurement.
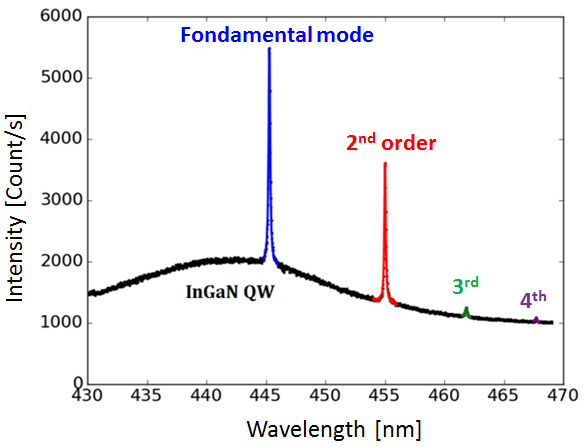
μPL measurements provide information about the optical and electronic properties of the material. Particularly, in nanobeam μPL, the background light is from the Quatum well emission and can be fitted with a Gaussian, while the 4 observed peaks refers to the different confinement mode of the photonic cristal and are fitted with a Lorentzian. By anylizing both the position and the quality factor of these curve, we can extract informations about the quality and the temperature of the nanobeam. The code for this sample curve is available in the folder src/μPL/sample-spectrum.
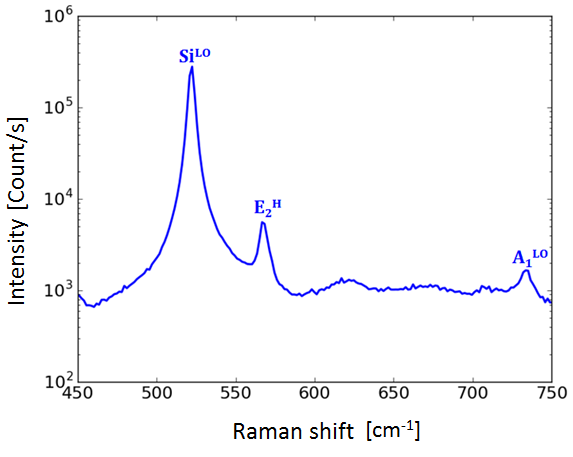
Three different modes are visibles on the Raman spectra, one corrsepond to silicon and the other two are GaN. The three peaks can be fitted with a Lorentzian, and by anylizing both the position and the quality factor of these curve, we can extract informations about the strain state of the nanobeam. The code for this sample curve can be found in the folder src/Raman/sample-spectrum.
The code is available in the src folder and requires Python 2.7. It returns the position and the quality factor of the peaks in the spectra and the results are then plotted as a function of time or position to check the evolution of the data. For Raman data, the spectra are simply fitted with a Lorentzian, but for the μPL, it proceed as follow:
- Fit the backgroung of the spectrum with a Gaussian by removing the points in the resonance peaks area
- Substract the dataset with the computed Gaussian
- Fit the two remaining peaks with a Lorentzian
To launch the data analysis, just run Fit.py, which will fit all the spectrum and write the result into a fitresult.csv file, then run plot.py to obtain the final graph. Every time a fit is performed, the fitted curve is ploted in the DEBUGFILE folder so one can check easily if the fit has been correctly performed by looking into the folder.
  Fitting data Gaussian:   1.0e+03 s-1     Peak energy: 445.54 nm
  Fitting data Lorrentz1:  2.7e+03 s-1     Peak energy: 445.51 nm
  Fitting data Lorrentz2:  2.1e+03 s-1     Peak energy: 455.11 nm
  Fitting data Gaussian:   1.0e+03 s-1     Peak energy: 444.19 nm
  Fitting data Lorrentz1:  4.0e+03 s-1     Peak energy: 445.27 nm
  Fitting data Lorrentz2:  3.0e+03 s-1     Peak energy: 455.00 nm
  Fitting data Gaussian:   1.0e+03 s-1     Peak energy: 442.02 nm
  Fitting data Lorrentz1:  3.5e+03 s-1     Peak energy: 445.30 nm
  Fitting data Lorrentz2:  2.3e+03 s-1     Peak energy: 455.02 nm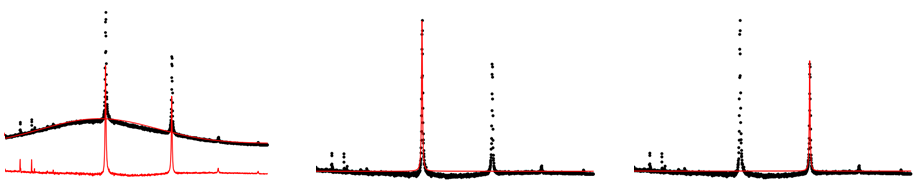
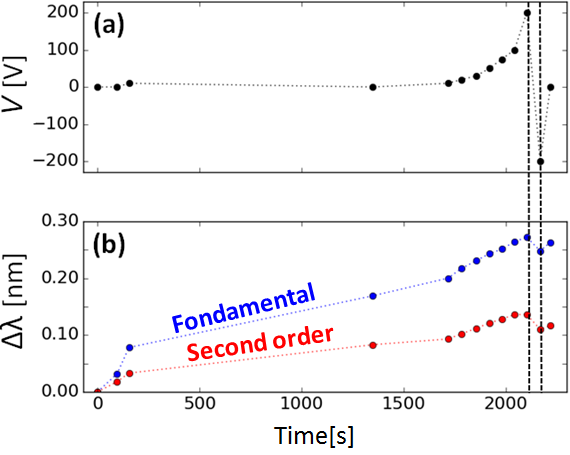
We have performed time dependent μPL analysis while changing the potential to see how the nanobeam is affected by a change in the external electric field. The μPL spectrum is measured at different time and the position of the peaks are exctracted thanks to Lorentzian and Gaussian fitting. The time evolution of the first and second mode of the photonic cristal is plotted on the right, and the graph indicate a small change in the wavelength when we go from 200V to -200V. The code for theses measurement is available in src/uPL/Time_plot.
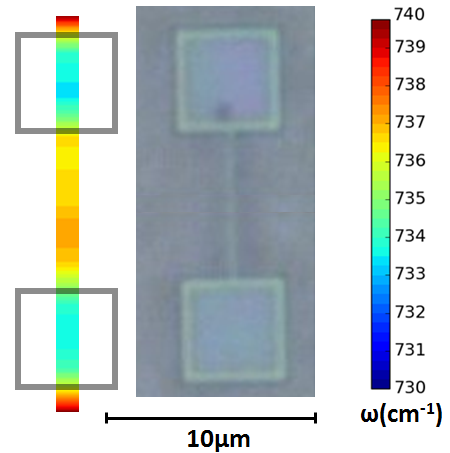
Raman measurements has been performed at different positions on the nanobeam. Each spectra are fitted with 3 lorentzians to extract the position of the modes, and the peaks positions are then plotted on a 2D map to easily check if some paterns are visible. The map clearly highlights a difference between the nanobeam and the PADs, which indicates a different strain state. The code for theses measurement is available in src/Raman/mapping_xy.
For more details about the methods used in our measurements, references, or more detailed results, you can check the report, available in the report/ folder.