In September 2016 we reported that commuters spend more than a tenth of disposable income on annual rail season tickets.
The data came from analysis of season ticket prices for the most popular commuter routes by Dan Wainwright, combined with data on local earnings, and data on route distances. Analysis was based on full time workers using an annual season ticket five days a week.
Season ticket price data was compiled manually by entering the most commonly used commuter services in six major cities (obtained from the Campaign for Better Transport) into the National Rail season ticket calculator
Route distances were calculated using the Google Places Distance Matrix API.
- Infographic: Cost of commuting
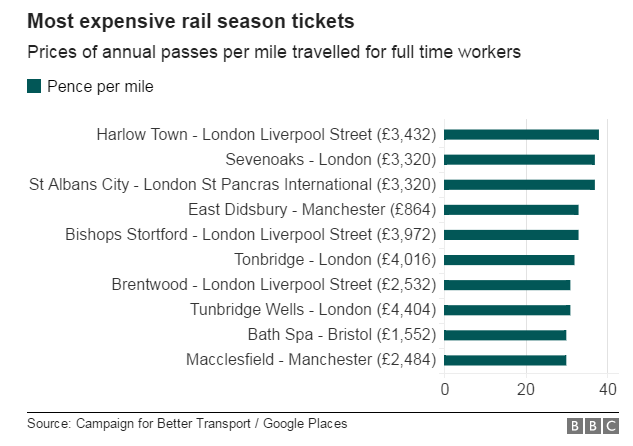
- Bar chart: Most expensive rail season tickets (shown above)
- Bar chart: Least expensive rail tickets per mile travelled
- Bar chart: Where your money goes
- Routes, distances, prices, local median wages, and calculations. Also available as a Google spreadsheet
- Office for National Statistics: median earnings by place of work
- Google Places Distance Matrix API
- Rail Delivery Group
- Campaign for Better Transport
- Commuters Natasha Ellingham and Matt Steel
- Merseyrail
- Department for Transport
We've written an explanation of how the Google Places API can be used to find out train journey distances here
In January 2017 we used similar techniques to report on rail season ticket rises. A separate repository for that story can be found here. You can see all fares-related stories under the 'fares' tag