Skip to content

Sales monitoring app - Python, MatPlotLib, Tkinter

Notifications You must be signed in to change notification settings

bruceallday/Homedesk

Folders and files

NameName
Last commit message
Last commit date

Latest commit


History

46 Commits


Repository files navigation

H o m e D e s k

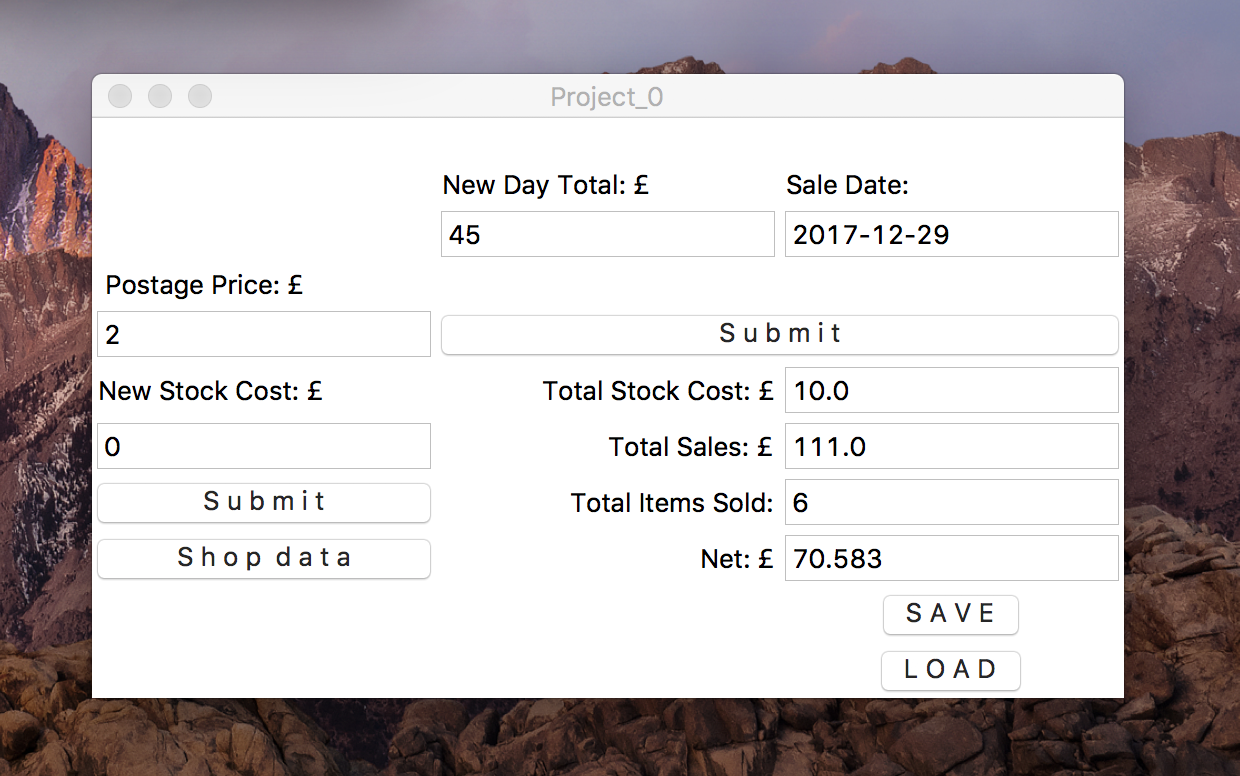
The idea of the homedesk app is to create a simple, easy to use data viz for an online shop. This example is based around keeping track of your sales on platforms like Ebay, Depop, Amazon etc

Installation

  1. Clone or Fork project
  2. Make sure you have the dependancies installed:
    • matplotlib
    • numpy
    • pickle
  3. Run in a python ^3.6.4 64-bit interpreter

screen shot 2018-07-01 at 14 30 48

Tool Bar

screen shot 2018-07-01 at 14 31 01

Add new items by price, date, and postage, the totals will be calculated in the toolbar and added to your graph.

Item Data

screen shot 2018-07-01 at 14 31 08

Keep a running count of individual item types and the total sales from that count.

Graph

screen shot 2018-07-01 at 14 31 25

See daily totals, everytime you add a new sale it is updated to the graph along with the new date. Use the built in Matplotlib toolbar to zoom in to specific days, weeks, or years. Save a screenshot so you can share your data.

Calculator

screen shot 2018-07-01 at 18 32 22

Simple calculator with percentage calculations feature. This will calulcate, and take away the percentage from the calculation. (-10%, -20%, -30%)

Conversions

screen shot 2018-07-01 at 19 20 18

A bunch of conversions put together into little widgets.

Packages

  • Tkinter
  • MatPlotLib
  • Pickle

Contributors

  • @BPouncey

© 2018 Bruce Pouncey

About

Sales monitoring app - Python, MatPlotLib, Tkinter

Resources

Stars

Watchers

Forks

Releases

No releases published

Packages

No packages published

Languages