Pattern Algorithms
Implementation: utils.py:getMaxMin
By default,
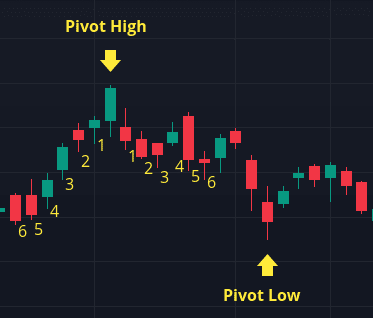
- a pivot high is a high, unbroken by 6 candles before or after.
- a pivot low is a low, unbroken by 6 candles before or after.
This means after a new local High or Low is formed, it takes 6 additional candles to confirm the pivot.
The getMaxMin(df, barsLeft=6, barsRight=6) function returns a Pandas Series of the pivot high and lows. The default argument ensures only major pivots are returned. The pivots are used to identify patterns.
You can tweak the result by changing the barsLeft and barsRight argument. Reducing the values will result in more pivots (major and minor) being returned.
Two points are considered on a straight line if their absolute difference falls within the average candle range (High - Low).
For ex: A and B are in a straight line in abs(a - b) <= averageCandleRange.
This is followed throughout the script, whenever straight lines are desired. Lines drawn across these points will often appear with some degree of slope.
Implementation: utils.py:isHNS
c > max(a, e) and max(b, d) < min(a, e) and f < e and abs(b - d) < avgBarLength
- C is the highest point
- A and E are below C
- B and D are lower than all other points
- F is the Close and has not breached E or D
-
avgBarLengthis the average candle range (High - Low) between B and D
HEAD & SHOULDERS (BEARISH)
                C
                /\
        A      /  \      E
        /\    /    \    /\
       /  \  /      \  /  \F
      /    \/________\/_______Neckline
     /      B         D
    /
Some patterns will have a degree of slope in the neckline. see Straight Line
Implementation: utils.py:findHNS
- Create a list of High and Low pivot points from the price data and assign it to P.
- F is the last Close value in the price data
- Set the highest point in
Pto C. - From the pivots P:
- Set the highest point before
Cto A. - Set the lowest point between
AandCto B - Set the highest point after
Cto E - Set the lowest point between
CandEto D
- Set the highest point before
- Check if points
A, B, C, D, E, and Fvalidate against the Head and Shoulder rules. - If not validated, set C equal to E (
Ebeing the next highest pivot) and repeat step 4. - If validated:
- Draw a trendline (Neckline) below
BandD. - If the last closing price has not breached below the neckline, we have a confirmed pattern.
- Draw a trendline (Neckline) below
         Symetrical                 Ascending                   Descending
          A                        A         C       E             A
         /\        C              /\        /\      /\            /\        C
        /  \      /\    E        /  \      /  \    /  \          /  \      /\      E
       /    \    /  \  /\       /    \    /    \  /    \        /    \    /  \    /\
      /      \  /    \/  F     /      \  /      \/      F      /      \  /    \  /  \
     /        \/      D       /        \/        D            /        \/      \/    F
    /         B              /          B                    /          B       D
Returns the first pattern that matches:
-
a > c > e and b < d < f and e > f(Symetrical Triangles) -
abs(a - c) <= avgBarLength and abs(c - e) <= avgBarLength and b < d < f < e(Ascending Triangle) -
abs(b - d) <= avgBarLength and a > c > e > f and f > d(Descending Triangles) - AvgBarLength is the average candle range (High - Low) between A to D.
Ascending and Descending Triangles can appear pointing upward or downward. In some rare cases, triangles may appear in a broadening formation. These are valid patterns and rules are purposefully set to allow these variations.