Historical Data analytics of my Gaming lifetime history
Python Pandas & SQL Project - EDA & Datavisualization of gaming habits
Having been a gamer all my life, the idea of this project is to list all the games I played, with several KPIs (score, hours played etc.), and visualize this gaming of a lifetime, to see some trends in my gaming behaviour.
- which genre did I play the most ?
- on which console ?
- for how long ? It is a nice way to remember all of gaming experiences, and to make something professional Python training & visualization of all this leisure time I had playing on those fantastic games !
Once the database created with SQL queries, I use various Python visualization libraries (Matplotlib, Seaborn, PyPlot, Bokeh) to visualize this gaming of a lifetime. Finally, I imported a Kaggle dataset encompassing scores of all the games I played (both from the Press & Players) to compare my scores given and theirs.
- Creation of a dataset of my overall gaming experience. SQL queries to create this ad hoc dataset with the following columns :
- CREATE TABLE my_videogames(
- id SMALLINT(6) UNSIGNED NOT NULL AUTO_INCREMENT,
- game_name VARCHAR(255) NOT NULL,
- console VARCHAR(20) NOT NULL,
- game_type VARCHAR(50) NOT NULL,
- finished BOOL NOT NULL, #have I finish the game or Not
- published_year SMALLINT(4) NOT NULL,
- played_year SMALLINT(4) NOT NULL, #first time I played the game
- hours_played SMALLINT(4), #approximation of hours spent playing the game
- perso_score SMALLINT(2) NOT NULL, #personal score on the game - rating over 100
- multiplayed BOOL NOT NULL, #have I played it with other persons
- Datavisualization with Pandas over those gaming data
- Comparison between my personal scores given to the games, and the existing Metascore given by the Press in general to those same games
Each row for one game played, with several cf. SQL queries for more detailed information over the dataset creation
- Finding key stats over my gaming lifetime :
- how many hours in average have I spent per gametype/console ?
- which are the years I played the most ?
- when comparing my grades given to all of those games, am I giving comparable grades to the critics (i.e. Metacritics) & in comparison to other players (i.e. playerscore) ?
-
DB_creation_SQL_queries : SQL queries for creation of the dataset
-
Notebook Pandas & Visualizations
- Pandas visualizations of the Gaming lifetime dataset
- Comparison of scores between this dataset and existing Metacritic dataset (TBD)
-
Plots_Charts_PNG
- PNG plots from Visualization notebook
My workflow consisted on 3 steps - each detailed in the relevant notebook:
1 - Database creation creating the database with SQL queries (brainstorming over the structure of the dataset, and some quality memory times to remember all those great games I played).
Each Workflow is detailed in its respective Notebooks.
2 - Data visualization & analaysis
3 - Importing Metacritic dataset Importing & Cleaning the dataset, then doing comparison & datavisualizations over those 2 datasets
- Import & minor wrangling
- Exploratory Data Analysis (EDA): Aims to approach the data from both a qualitative and a quantitative standpoint for main insights
2. Visualizing gaming of a lifetime dataset
- Data visualizations: plots over KPIs (seaborn & pyplot)
- Monthly churn rate and Cohort Analysis: Aims to identify monthly churn rates and performance measurement through customer cohort analysis on retention rates
3. Comparison of Scores with complete video game dataset
- Importation & Data transformation : import & clean 16.8K rows dataset
- Merging & EDA of two dataframes
- Comparison plots
1. Data exploration
2. Visualizing gaming of a lifetime dataset
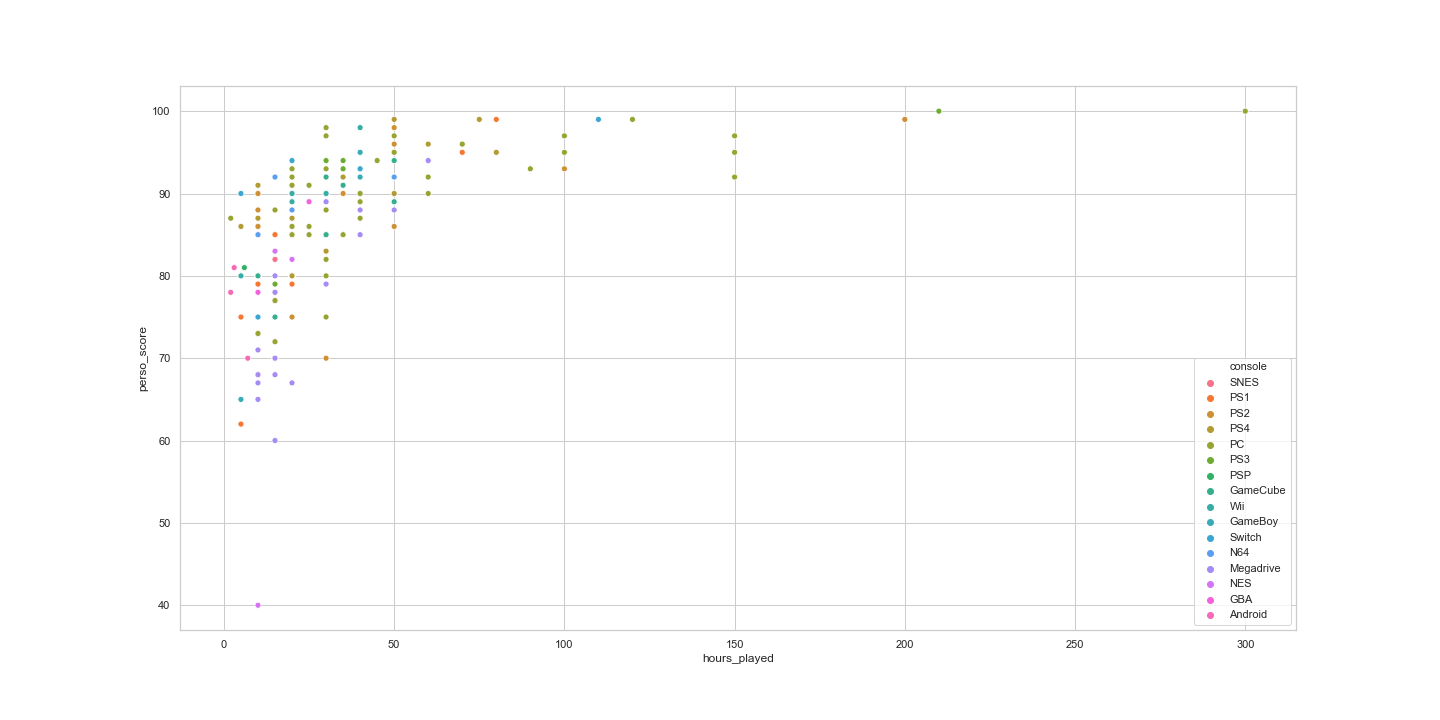
Amount of hours played distribution Main gaming habits explored :
- Distribution of average amount of hours per game
- Slightly right skewed distribution, with most games having between 20 & 30 of playedhours - few outliers greater than 100 hours
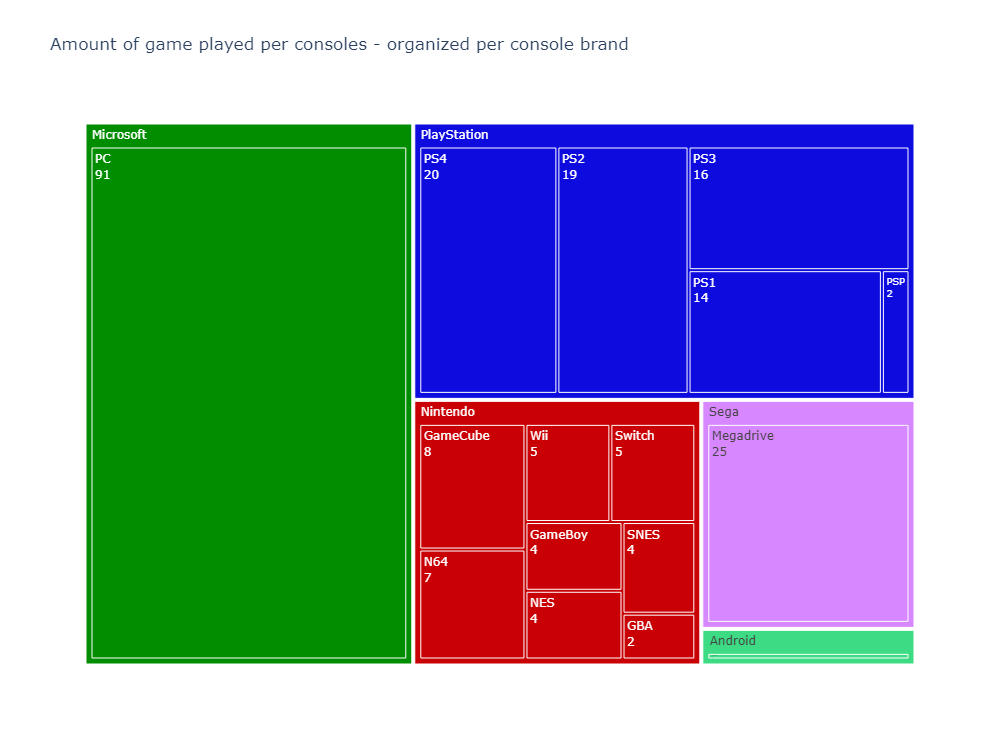
Distribution per system
Using Plotly to create dynamic Treemap of game per console, divided by brand.
Platfrom & Brand distribution
#Hover effect plot
On dynamic notebook version, displaying game type when hovering
- Microsoft & PC is the most played system
- PlayStation & Nintendo systems have the most different system used.
Genre distribution
- Action-Adventure games assess for top games
- PC strategic games (STR) & old-school platforms are the second most played games, regardless of the amount of time spent on each of them

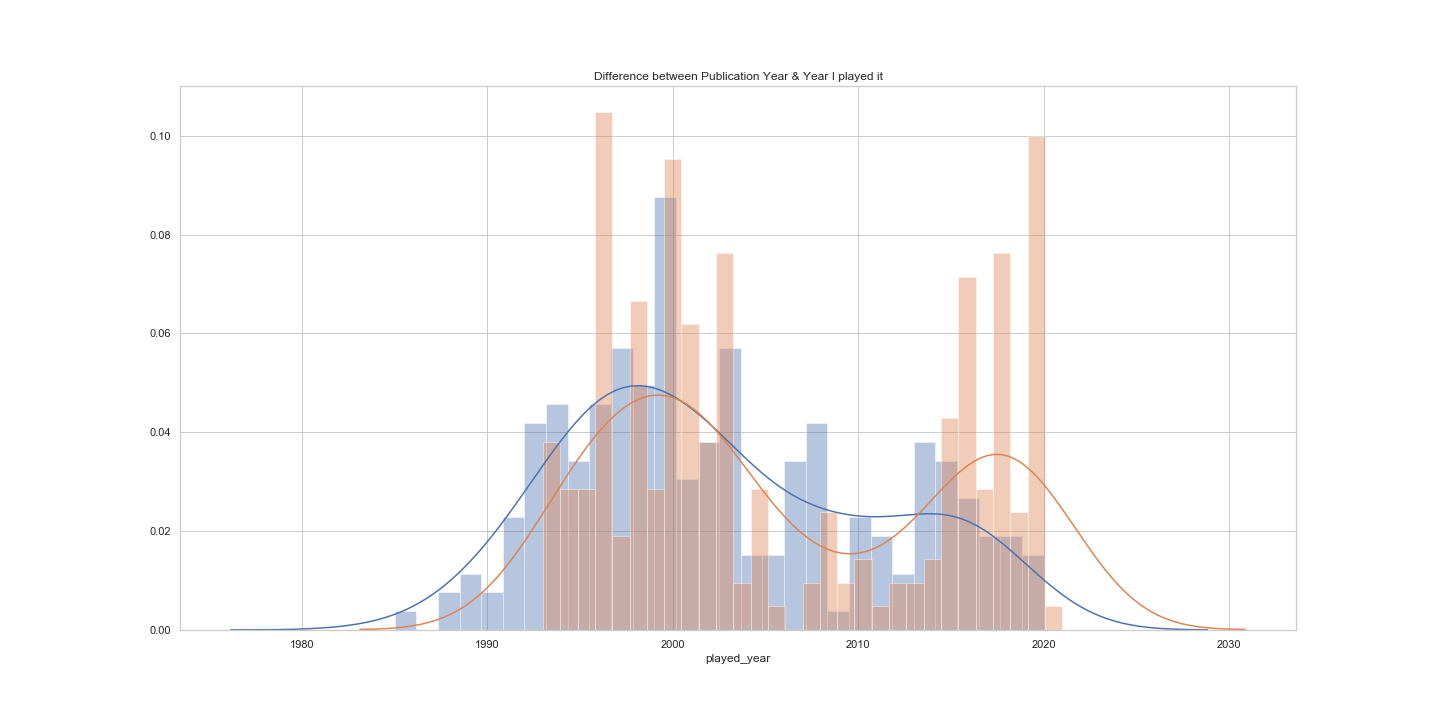
Published year VS. played year Quick analysis comparing the release year of a game VS. the actual year I played it. Overall, I have the tendency to play games 1 or 2 years after their release ; truth be told, I usually look for metacritics, scores & reviews before spending hours on a game. Hence the following analysis over scores and ratings comparison
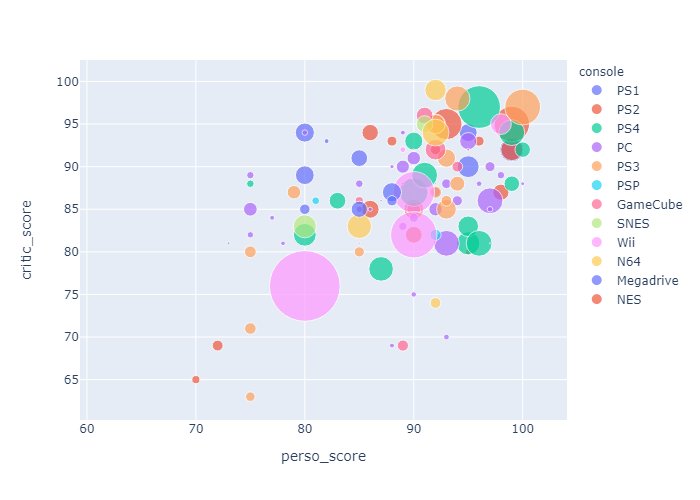
3. Comparison of Scores
Comparing with complete video game dataset On the second notebook, using Plotly to create dynamic scatter plot to compare my personal score VS. metacritic scor (on a 100 scale)
- Adding new dimension with sales per game Bubble-size relies on overall sales for each game - in order to measure whether good critics equal massive sales
Fun projects to practice SQL & DataViz
- Comparable score ranking with metacritics' scores
- Mostly PC STR & platformers during early period - OpenWorld & Action Adventure in recent years
- PlayStation is the most represented brand
- using Bokeh
- PostGreSQL version
- analyzing global & continental sales VS. scores