overview
The purpose of this toolbox is to track objects in time-lapse microscope images. The toolbox is implemented using the Linear Assignment framework using the method described by Khuloud Jaqaman.
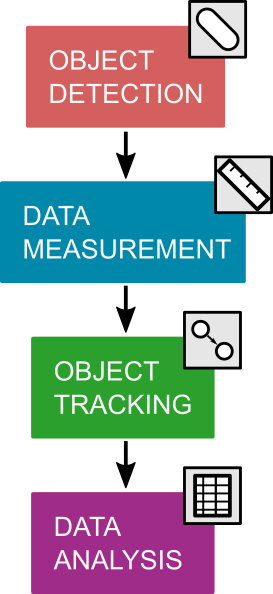
A typical image analysis pipeline is shown in the figure above. This toolbox assists with the third step: object tracking. This means that you will need to write your own object detection (or segmentation), as well as data measurement code (or use regionprops in MATLAB).
In the linear assignment framework, each cell is assigned a score that represent the probability that it is the same cell detected in the previous frame. These scores can be either distance between centroid positions (a.k.a. nearest-neighbor tracking) or the ratio of overlapping pixels. In the latter, to get a score for the degree of overlap, we use the ratio of the number of intersecting pixels with the number of union pixels, as shown in Fig. X. This scoring method works well since PCC 7002 is non-motile.

Once the scores for each cell is computed, the linear assignment is carried out and each cell in the current frame is either assigned as part of an existing track or a new track is created. Scores are also provided for cells in previous frames that might be lost (i.e. tracking should stop), due to drifting out of the field of view or being obscured by another cell. The outcomes are solved by minimizing the total cost of the assignments.
Cell division was tested for during the tracking process when new tracks are created. Again, we used the overlap score to determine if division occurred (i.e. if two cells overlapped at least 40% or more with the same mother cell in the previous frame).
In the original publication, the centroid position was used to identify each cell. However, we found this method problematic as cyanobacteria cells are cylindrical, which meant that the algorithm occasionally confused parallel neighboring cells. We therefore used the ratio of overlapping pixels between frames instead.
This toolbox was written from scratch based on the Nature Methods paper above. However, several changes have been made:
- The toolbox uses the Jonker-Volgenant algorithm to solve the assignment
- We have added a score calculation to compute percent of overlapping pixels
If you need help using the code, please send us a ticket at biof-imaging@colorado.edu.
If you found a bug, please submit a report on the Issue Tracker
If you use this toolbox, we would appreciate an acknowledgement in your publication/presentation. You can find a sample acknowledgement below. If your work ends up being published, please let us know. This helps us provide reliable measures of impact to report to funders and increase our competitiveness for future grants.
Sample statement
This [publication/report] was made possible by analysis code provided by the BioFrontiers Advanced Light Microscopy Core.