NeoGebra is a tool that can be used for creating, visualizing, understanding and verifying Euclidean and Non-Euclidean models.
- Sample Non-Euclidean models built-in, such as the Poincare model, Beltrami-Klein model and the half plane model.
- Compare models
- Custom Non-Euclidean models, with your own identifiers
- Postulates verifier
- Windows / Linux
- NeoGebra
First of all, you can either choose a model that you would like to work in or begin from scratch. The model can be chosen with the menu on the top, or by creating your own model. If you would like to know more about creating models, refer to this section.
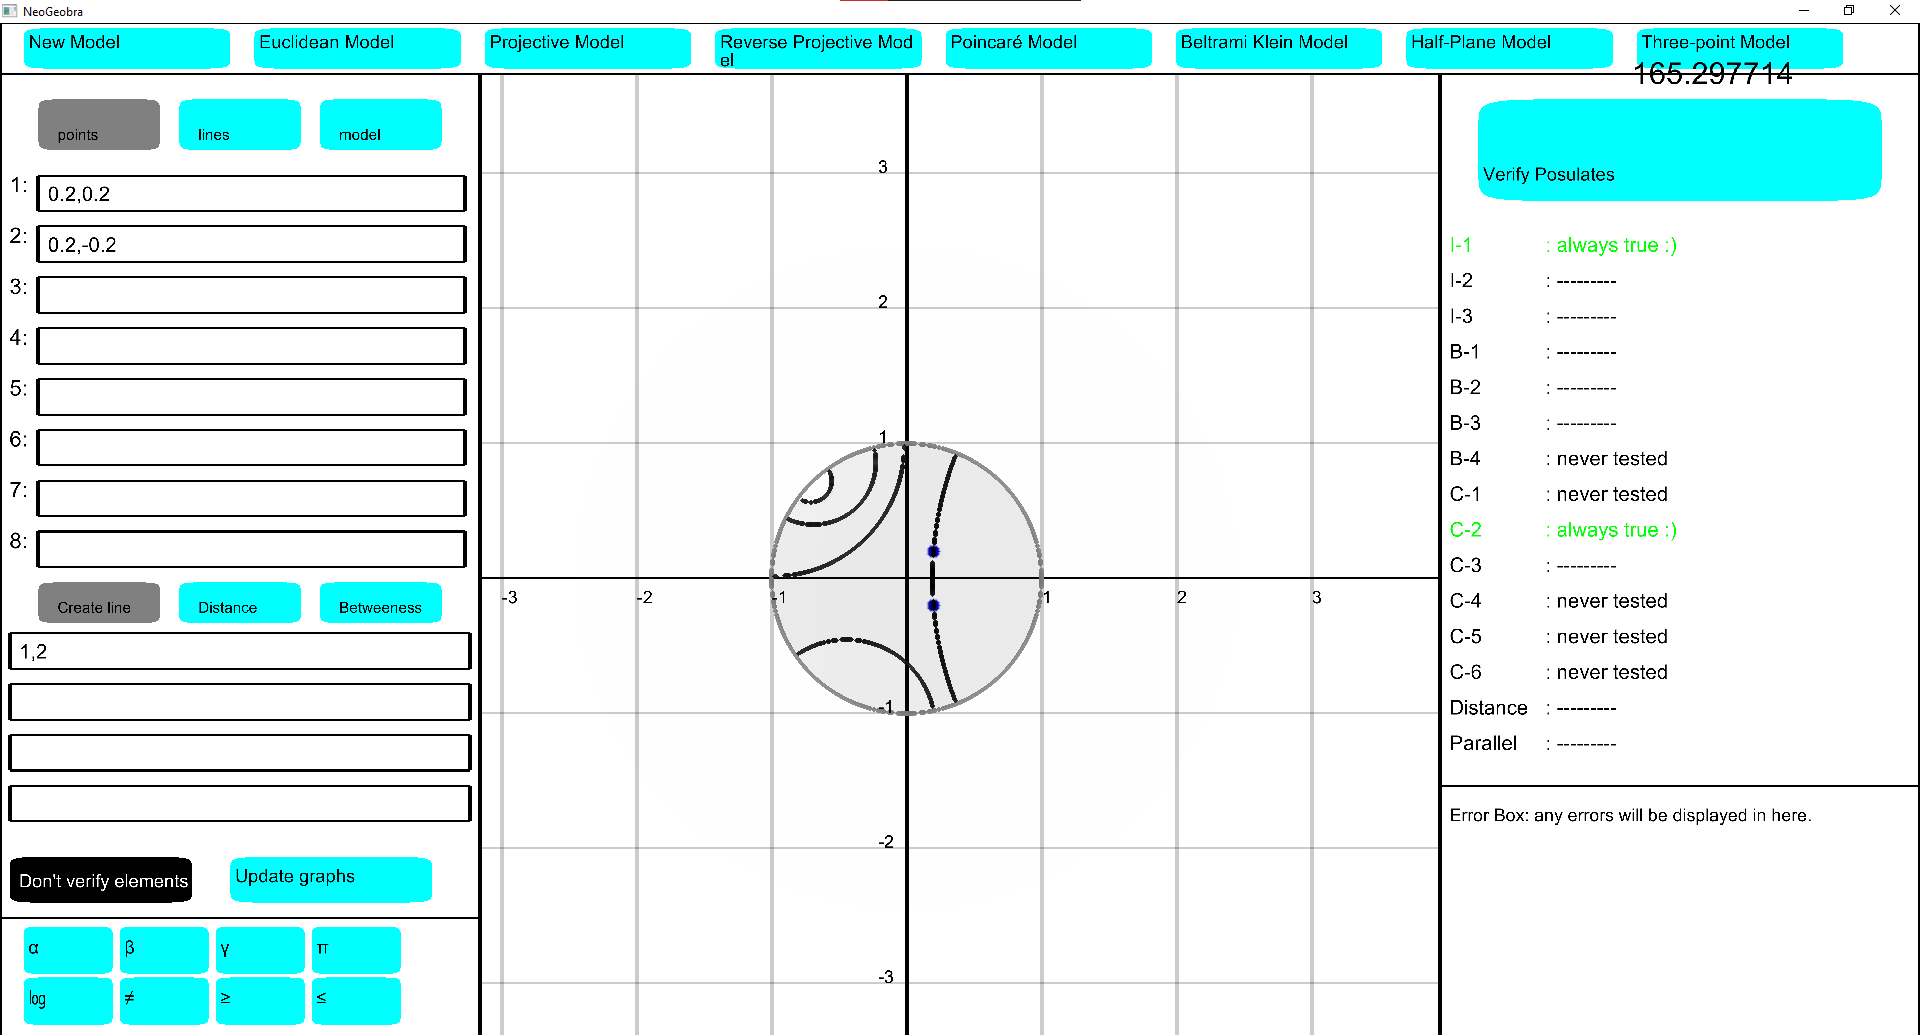
The first undefined term is a point. This may sound simple, but it is already different for the models. In the three-point model a point is defined by one identifer, and in the others it is defined by two or even three identifiers. To actually create a point you have to fill in the identifiers in the 'points' tab. This can be done by separating each identifier by a comma ( , ). For example valid points in the Poincare model would be:
0.5, 0.51
0.1,-0.20
For decimals you should use a point ( . )
To update the graphs after you changed the values you can click the button at the bottom of the screen, or hit enter while having on of the input fields selected.
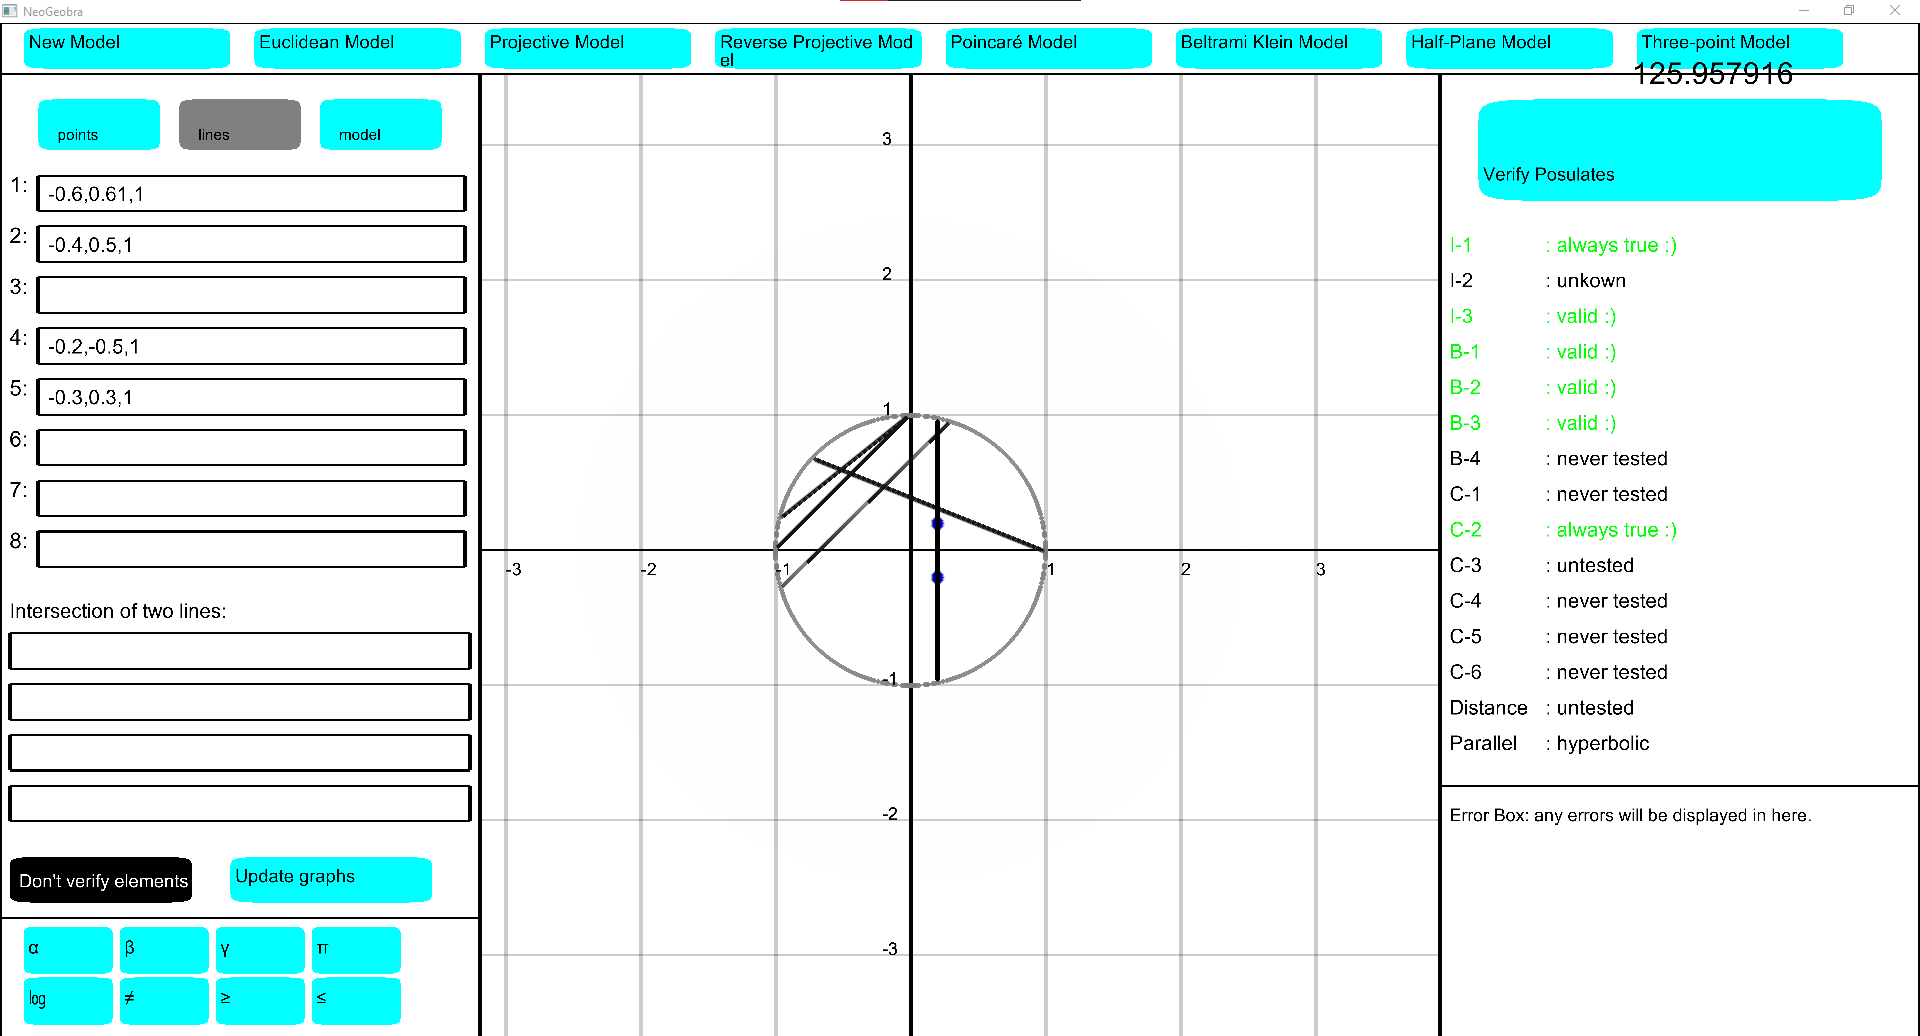
Just like a point, a line isn't universally defined. Each model has it's own definition, for example the Poincare model and the half-plane model have 3 identifiers, while the half-plande model has two. Again, identifiers are separated by a comma ( , ), but are put in the 'lines' tab.
Half-plane model line examples:
1, 2
3, 0
For decimals you should use a point ( . )
To update the graphs after you changed the values you can click the button at the bottom of the screen, or hit enter while having on of the input fields selected.
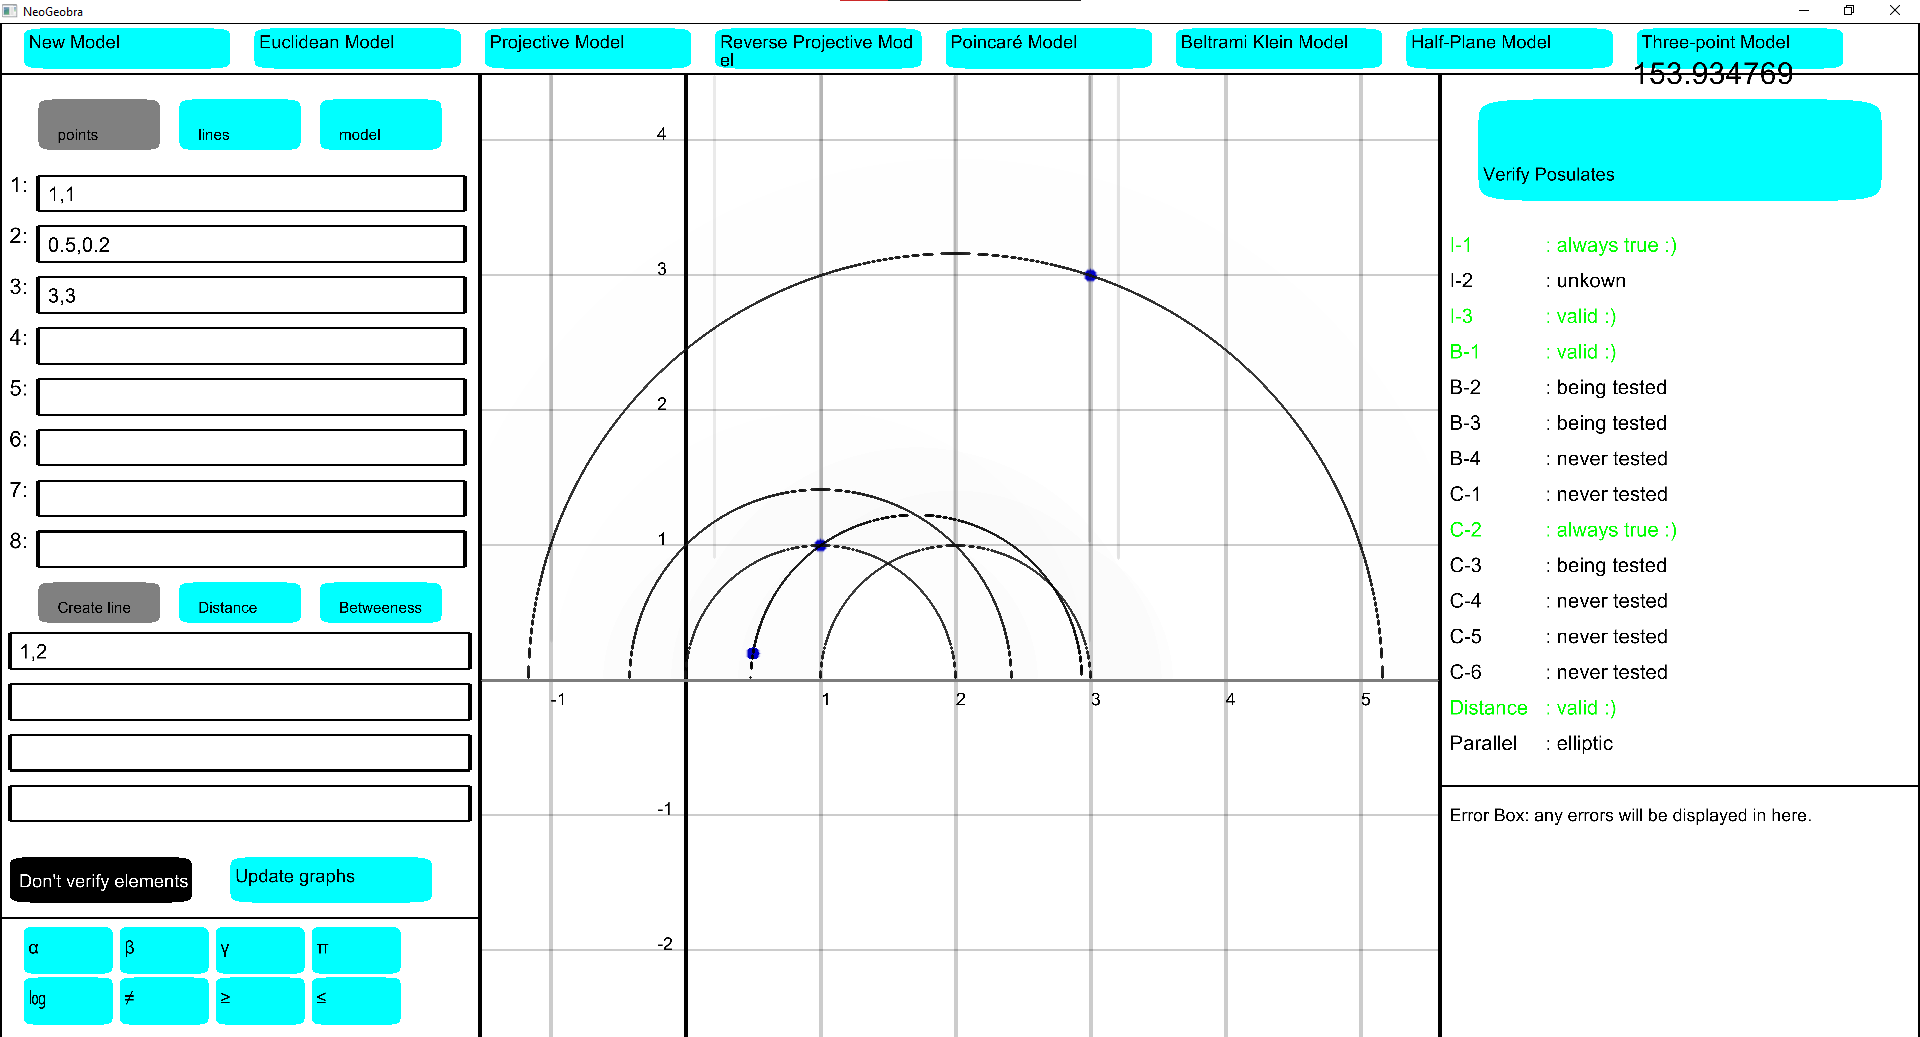
If you would like to construct a line from 2 points, you will first have to create 2 points.
Once you create the 2 points, you can create a line simply by using the index of the points. Let's say you have points:
1️⃣: 0.1,0.1
2️⃣: -0.1,0.3
You can create a line in this way:
1,2
This will draw a line on the graph through both points.
Note: this might be quite slow if a definition for a line from two points does not exist. All pre-defined models have this defined.
If you would like to get the point of intersection from 2 lines, you will first have to create 2 lines.
Once you create the 2 lines, you can get the point by using the index of the lines. Let's say you have lines:
1️⃣: 0.1,0.1
2️⃣: -0.1,0.3
You can get the point in this way:
1,2
This will draw the point of intersection of both lines.
Note: this might be quite slow if a definition for a point from two lines does not exist. All pre-defined models have this defined.
The right hand side of the screen is the postulate verifier section. With this you can verify your model in accordance with the non-Euclidean incidence, betweennes, congruence, distance and parallel postulates. To start verifying the postulates, you can simply click on the Verify Postulates button on the top of the section. When you do so, each postulate will be verified concurrently. Here are the meanings of messages you might see:
| Message | Meaning |
|---|---|
| being tested | Busy testing postulate |
| valid :) | Postulate holds |
| invalid | Postulate does not hold |
| unknown | Couldn't find a solution |
| hyperbolic / elliptic / euclidean | The result for the parallel postulate |
| always valid :) | Postulate will always be valid because of the way terms are defined in this program |
| never tested | This postulate is currently not tested because it is too complex |
In NeoGebra you have the ability to create your own models. This can be done by filling in the following points. These definitions can be filled in under the 'models' tab on the left of the screen. After you changed the definitions you have to update the model by either clicking the button at the bottom of the screen or pressing enter while having on of the model input field selected.
What does a point mean in your model? Is it a Euclidean point or do you have to convert it? Is your model infinite in the sense of Euclidean geometry when you display it on a plane? Or are its boundaries the unit circle like the Poincare model or the Beltrami-Klein model? You have full control of what you want a point to be: you could even make it to be the equation:
x^3 + y^2 + y + x = 2
A point could be identified by 1 or more identifiers and has its boundaries set. For example all points within the unit circle could be defined as:
x = p0 & y = p1 & x^2 + y^2 < 1
This basically means that, the x coordinate is equal to p0 (first point identifier), and the y coordinate is equal to p1. AND that the point is within the circle with radius 1. These identifiers p0 and p1 are defined when you create a point. For example when creating the point
1,4
the identifiers would be:
p0 = 1 and p1 = 4
The definition for a point can be filled in right under the word Point. On the right of this word are a few other input fields. The first is Variables: clicking this will open a new window where the variables can be defined. For information on this see this section. Next to this is the identifier of the point. This changes the letter used in the equation for identifiers. For example changing this to k means that the previous equation becomes:
x = k0 & y = k1 & x^2+y^2 < 1
The last two input fields are for the rendered size of the points (or whatever you want the term 'point' to be) and the last one changes the number of identifiers you used.
What's the formula of a line in your model? It could be a straight Euclidean line , or an arc of a circle of whose center is outside the unit circle for example. You will have to define the formula of a line using as many identifiers as you wish. A Euclidean line is usually defined as y = ax + b or ax + by = c.
This could be translated to:
| y = ax + b | ax + by = c |
|---|---|
| y = l0 * x + l1 | l0 * x + l1 * y = l2 |
| l0,l1 | l0,l1,l2 |
With the first example, we have 2 line identifiers, however with the second one we require 3 identifiers. The input fields are the same as for a point. Again, refer to this section if you have questions about those.
You will also have to define the definition of intersection between a point and a line. When is point p considered to be on line l? We will continue with the same example given in the line definition section. Take definition of line l :
l0*x+l1*y=l2 & x^2 + y^2 < 1
And point definition:
x = p0 & y = p1 & x^2 + y^2 < 1
In this case, filling in point p in the line definition is sufficient to check if it's valid.
p0*l0+l1*p1=1
So this will be your incidence definition.
Here you will have to define a betweennes axiom in your model. Let's say you have points {p,q,r}. Then the definition will have to validate if q is between p and r, and if q is between r and p. For examples you can view the built-in models
Here you will have to define an equation to calculate the distance between 2 points. To make it clearer, to calculate distance between Euclidean points you use this formula:
Point P (p0,p1), Point Q (q0,q1))
distance(P,Q) =
You can create a definition of creating a line using 2 points. Your input will be points and the output will be a line (if possible) drawn on the graph. For examples you can view the built-in models
how to get the value of 2 lines with a point You can create a definition of 2 intersecting lines. As an input you will use 2 created lines and as an output a point will be drawn (if possible) on the graph at the intersection point. For examples you can view the built-in models
The main goal of variables is to make definitions more readable and easier for you. You can define variables in the variable menu. To access the variable menu, you click on the button vairables next to the field of the definition. A variable menu will pop-up where you can specify the name the variable on the left-side, and it's value on the right-side.
✅ You can use point identifiers in the definition , such as p0,p1,q0,q1
❌ You can not use x or y in the definition
Let's say you created a point variable r, to access it in the definition of a point you simply use : p.r.
If you created a line variable n, you can access it similarly with l.n. These variables can be used in any of the definitions. So you can even say p.r in the defintion for distance.
Just like extra variables you can add in extra lines to help you visualize your models. For example in the Poincare or Beltrami-Klein models you can add a unit circle to help you visualize it. These equations can be changed by clicking the button next to the update model button.
These instructions are to run NeoGebra on Windows. It is tested on GNU/Linux too and to build it, just do whatever you normally do to build a project with CMake.
- Clone the repository using the following command
git clone https://github.com/Bram05/NeoGebra.git --recursive- Open the project in Visual Studio 2022.
- Run the program with
F5.
This program is built for a school project and made by: