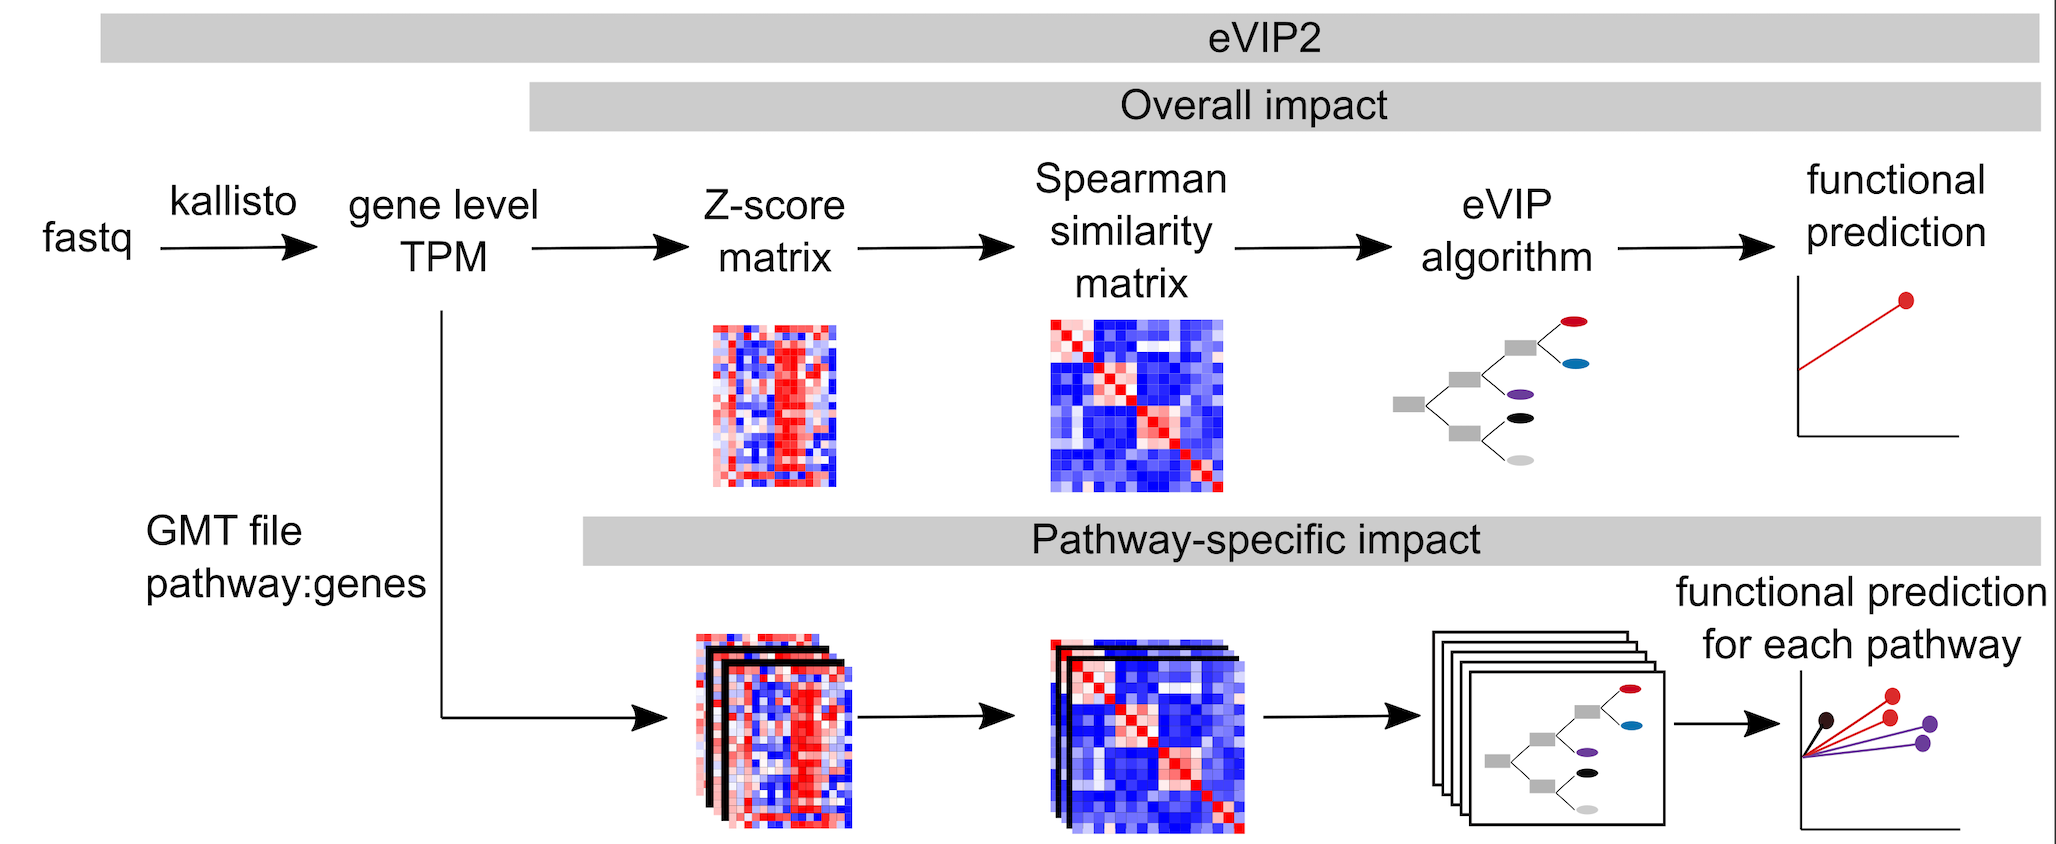
Expression-based variant impact phenotyping (eVIP) is an approach to predict functional impacts of mutations by comparing gene expression signatures induced by wild-type vs. mutated ORFs. eVIP2 is an updated version of eVIP that can predict functional impact on the pathway level in addition to the overall functional prediction.
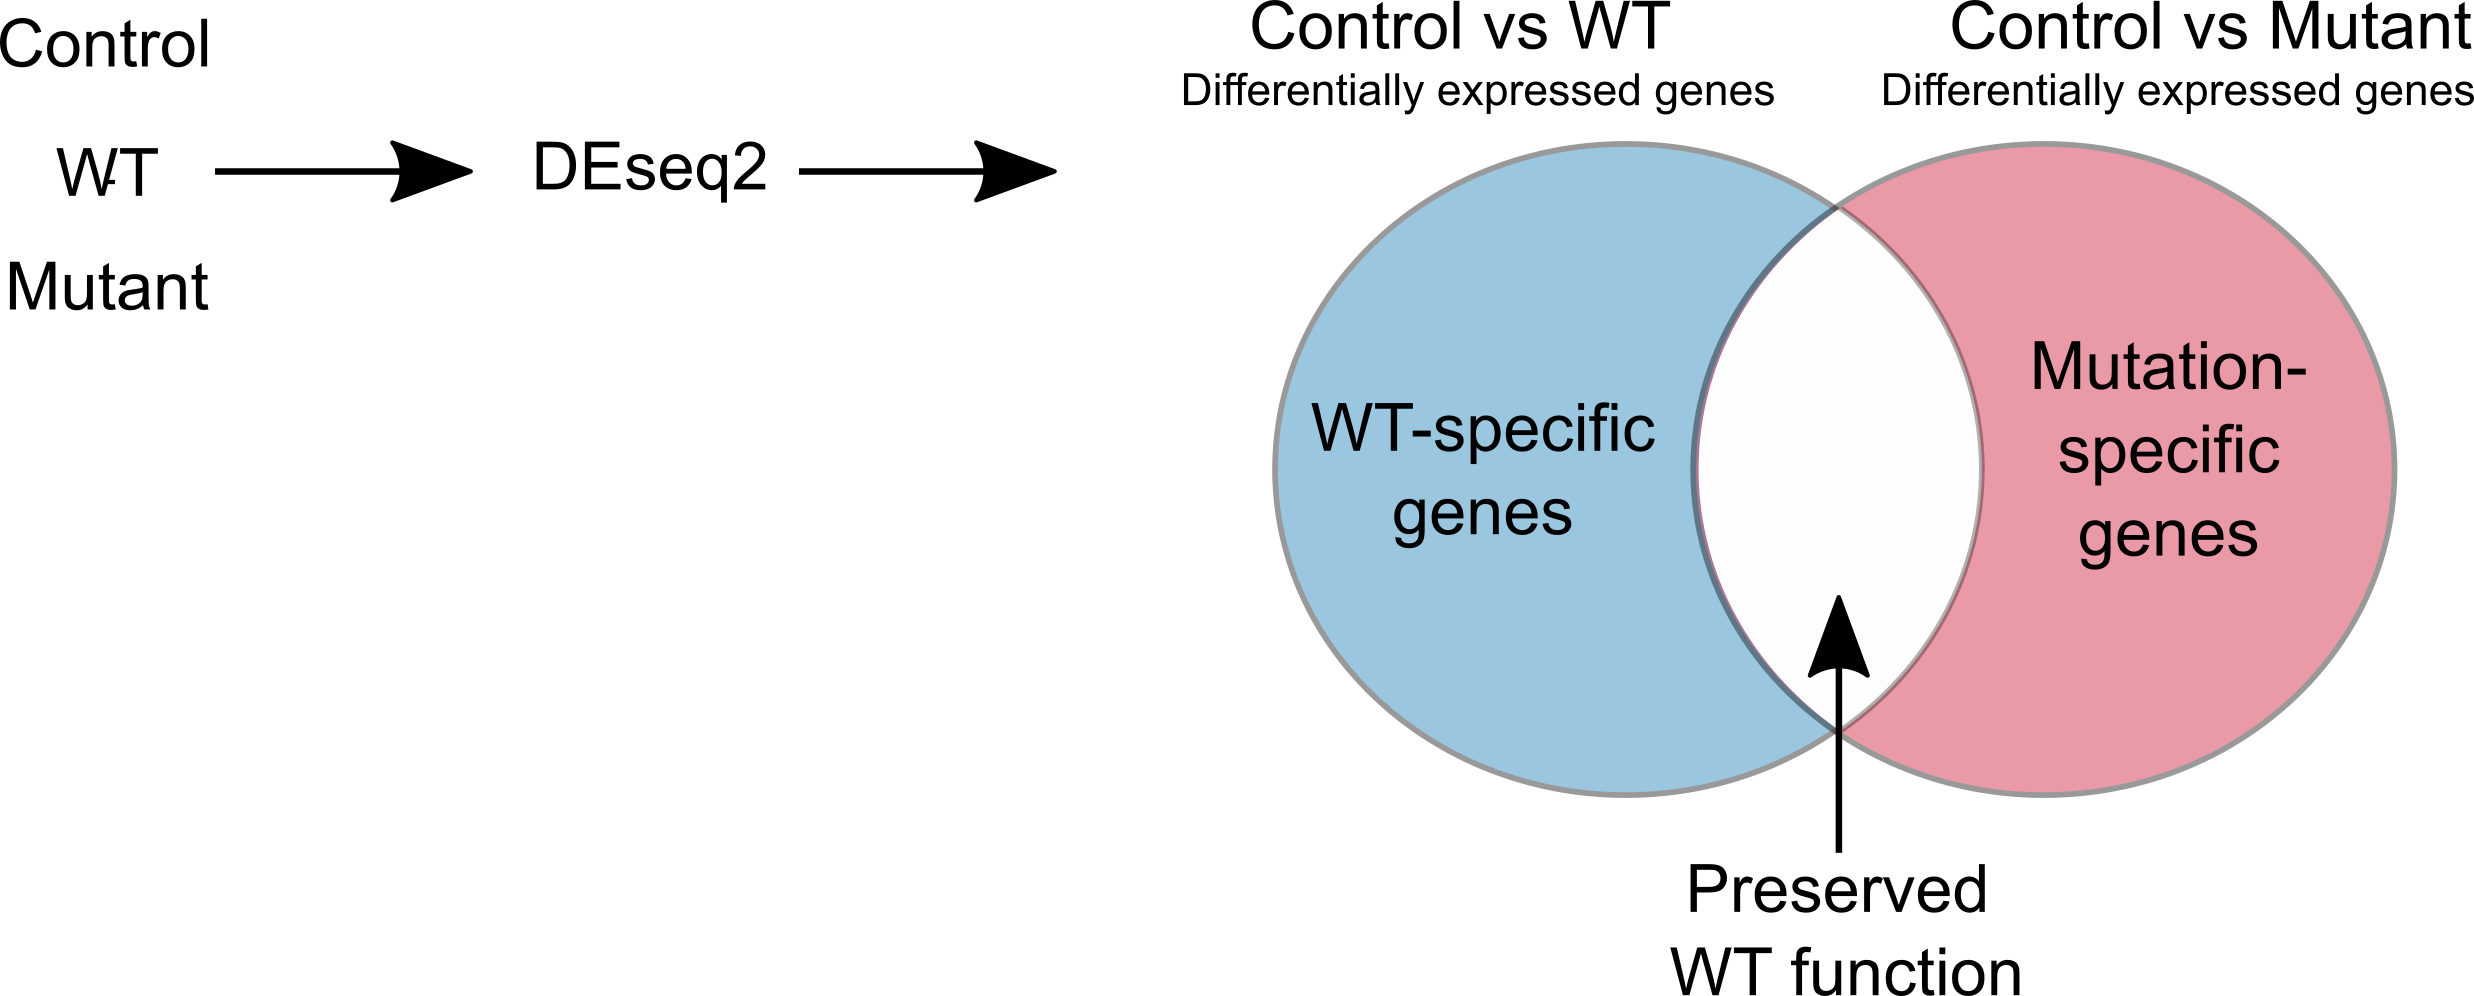
For pathway analysis, eVIP Pathways first finds differentially expressed genes that are specific to the WT or mutant. The WT gene and each mutant are compared to the control using DESeq2. We define mutation-specific genes as genes that are differentially expressed only in the control vs mutation and not in the control versus WT. These genes represent a new function caused by the mutant. The WT-specific genes are differentially expressed only in the control versus WT and not in the control versus mutant. These are genes that are expected to be affected by normal WT function, but are not affected by the mutant, and therefore contribute to mutant loss of function. eVIP Pathways is then run separately using the WT-specific and mutant-specific genes (with multiple-testing correction).
The eVIP method was originally described in Berger et al. 2016
High-throughput Phenotyping of Lung Cancer Somatic Mutations Berger AH, Brooks AN, Wu X, Shrestha Y, Chouinard C, Piccioni F, Bagul M, Kamburov A, Imielinski M, Hogstrom L, Zhu C, Yang X, Pantel S, Sakai R, Watson J, Kaplan N, Campbell JD, Singh S, Root DE, Narayan R, Natoli T, Lahr DL, Tirosh I, Tamayo P, Getz G, Wong B, Doench J, Subramanian A, Golub TR, Meyerson M, Boehm JS. Cancer Cell, Aug 8;30(2):214-28
The eVIP2 method was described in Thornton et al. 2021
eVIP2: Expression-based variant impact phenotyping to predict the function of gene variants. Alexis M. Thornton, Lishan Fang, April Lo, Maria McSharry, David Haan, Casey O’Brien, Alice H. Berger , Marios Giannakis , Angela N. Brooks. PLoS Comput Biol. 2021 Jul 2;17(7):e1009132. doi: 10.1371/journal.pcbi.1009132. PMID: 34214079; PMCID: PMC8281988.
Git repo containing eVIP2 paper analysis
We provide a docker container to run eVIP2. The requirements are listed in the environment.yml and the Dockerfile files.
An example of each required input file is available in eVIP2/tutorial_files.
run_eVIP.py input options
--infile: RNA-seq log2 transformed and filtered gene expression table-zscore_gct: L1000 z-score ".gct" file
run_eVIP2.py requires transcript quantification outputs from
kallisto. -input_dir should be a directory that contains the different kallisto output directories for each sample.
The names must match those used in "distil_id" column in the -sig_info file.
This file indicates which samples are replicates of which conditions. The cell_id and ie columns are not used and can be given any value.
The reference file is a .tsv file that describes which WT to mutant comparisons to do.
File to list the controls in the experiment. The control name should match the "sig_id" in the -sig_info file
When running eVIP Pathways (using -eVIPP) additional files are required.
-gmt .gmt file with pathways and the associated genes
-gtf Gtf file used to convert transcript counts to gene counts
-control If there is more than one control in the controls file (-c), designate which should be used for DEseq2
This file is used to group genes into categories when creating sparkler plots. The accepted gene labels are:
TSG(tumor suppressor gene)ONC(oncogene)TSG_noTP53(tumor suppressor gene, not TP53)ONC-NEG(oncogene-negative)
To run the eVIP pipeline, use run_eVIP.py. We recommend the input data (--infile) has the low expressed genes filtered out and is log2 transformed. This can be done by using the filterGeneExpression.py script.
run_eVIP.py [-h] [--infile INFILE] [-zscore_gct ZSCORE_GCT] -out_directory OUT_DIRECTORY -sig_info SIG_INFO -c C -r R -num_reps NUM_REPS [-ie_filter IE_FILTER] [-ie_col IE_COL] [-i I] [-allele_col ALLELE_COL] [-conn_null CONN_NULL] [-conn_thresh CONN_THRESH] [-mut_wt_rep_thresh MUT_WT_REP_THRESH] [-disting_thresh DISTING_THRESH] [-mut_wt_rep_rank_diff MUT_WT_REP_RANK_DIFF] [-use_c_pval] [-cell_id CELL_ID] [-plate_id PLATE_ID] [-ref_allele_mode] [-x_thresh X_THRESH] [-y_thresh Y_THRESH] [-annotate] [-by_gene_color BY_GENE_COLOR] [-pdf PDF] [-xmin XMIN] [-xmax XMAX] [-ymin YMIN] [-ymax YMAX] [-viz_ymin VIZ_YMIN] [-viz_ymax VIZ_YMAX] [-corr_val CORR_VAL] [-eVIPP] [-JSON JSON] [-gmt gmt][-min_genes MIN_GENES] [-viz_off] [-sparkler_off]
usage: run_eVIP2.py [-h] [-min_tpm MIN_TPM] [--infile INFILE] [-zscore_gct ZSCORE_GCT] -out_directory OUT_DIRECTORY -sig_info SIG_INFO -c C -r R -num_reps NUM_REPS [-ie_filter IE_FILTER] [-ie_col IE_COL] [-i I] [-allele_col ALLELE_COL] [-conn_null CONN_NULL] [-conn_thresh CONN_THRESH] [-mut_wt_rep_thresh MUT_WT_REP_THRESH] [-disting_thresh DISTING_THRESH] [-mut_wt_rep_rank_diff MUT_WT_REP_RANK_DIFF] [-use_c_pval] [-cell_id CELL_ID] [-plate_id PLATE_ID] [-cond_max_diff_thresh COND_MAX_DIFF_THRESH] [-ref_allele_mode] [-x_thresh X_THRESH] [-y_thresh Y_THRESH] [-annotate] [-by_gene_color BY_GENE_COLOR] [-pdf PDF] [-xmin XMIN] [-xmax XMAX] [-ymin YMIN] [-ymax YMAX] [-viz_ymin VIZ_YMIN] [-viz_ymax VIZ_YMAX] [-corr_val CORR_VAL] [-eVIPP] [-JSON JSON] [-gmt GMT] [-min_genes MIN_GENES] [-viz_off] [-sparkler_off] [-input_dir INPUT_DIR] [-input_gene_tpm INPUT_GENE_TPM] -gtf GTF [-control CONTROL] [-tx2gene]
├── kallisto_files
├── eVIP_out
|     ├── z_scores.gct
|     ├── spearman_rank_matrix.gct
|     ├── compare_conn_null.txt
|     ├── compare.txt
|     ├── predict.txt
|     ├── sparkler_plots
|     └── viz
├── deseq2
├── eVIPP_out
|     ├── mutation
│     │      ├── eVIP_files
│     │      ├── wt_specific
│     │      └── mutation_specific
│     │      │        ├── eVIPP_combined_predict_files.txt
│     │      │        ├── eVIPP_summary.txt
│     │      │        └── eVIPP_sparkler_plots
eVIP will create a folder named "eVIP_out" containing the results to the overall functional eVIP analysis. The results file is "predict.txt" and different visualizations can be found in the "sparkler_plots" and "viz" directories.
When running eVIP Pathways (-eVIPP, -gmt, and -gtf), the results will be in "eVIPP_out", which will contain be a directory for each mutation. For each mutation, eVIPP is run separately using the wt-specific and mutation-specific genes. The eVIPP_combined_predict_files.txt file contains all the results from the individual pathway files combined into one file. eVIPP_summary.txt summarizes the results, showing the pathway and its functional prediction. The eVIPP sparkler plot is a combined visual representation of all the pathway predictions for that mutation. The directory structure is the same for the wt_specific eVIPP results.
Interactive html sparkler plots are also created (example).
If plots made by eVIP_viz.py are blank, adjust the min and max.
      -h, --help            show this help message and exit
      --infile INFILE       Input txt file (filtered and log transformed data).
      -zscore_gct ZSCORE_GCT
                            Zscore input gct file (use instead of --infile)
      -out_directory OUT_DIRECTORY
                            Path to directory for eVIP output files
      -sig_info SIG_INFO    sig info file with gene information and distil
                            information
      -c C                  .grp file containing allele names of control
                            perturbations. If this file is given, a null will be
                            calculated from these
      -r R                  File explicitly indicating which comparisons to do.
                            Assumes the file has a header and it is ignored. The
                            first column is the reference allele and second column
                            is test allele. If this file is not given, then the
                            reference alleles are assumed to be WT and inferred
                            from the allele names.
      -num_reps NUM_REPS    Number of replicates expected for each allele. DEF=3
      -ie_filter IE_FILTER  Threshold for infection efficiency. Any wildtype or
                            mutant alleles having an ie below this threshold, will
                            be removed
      -ie_col IE_COL        Name of the column in the sig_info file with infection
                            efficiency information. DEF=x_ie_a549
      -i I                  Number of iterations to run. DEF=1000
      -allele_col ALLELE_COL
                            Column name in sig_info file that indicates the allele
                            names.DEF=x_mutation_status
      -conn_null CONN_NULL  Optional file containing connectivity null values from
                            a previous run. Should end in _conn_null.txt
      -conn_thresh CONN_THRESH
                            P-value threshold for connectivity vs null.
                            DEFAULT=0.05
      -mut_wt_rep_thresh MUT_WT_REP_THRESH
                            P-value threshold for comparison of WT and mut
                            robustness. DEFAULT=0.05
      -disting_thresh DISTING_THRESH
                            P-value threshold that tests if mut and wt reps are
                            indistinguishable from each other. DEFAULT=0.05
      -mut_wt_rep_rank_diff MUT_WT_REP_RANK_DIFF
                            The minimum difference in median rankpoint WT and mut
                            to consider a difference. DEF=0
      -use_c_pval           Will use corrected p-value instead of raw p-val
      -cell_id CELL_ID      Optional: Will only look at signatures from this cell
                            line. Helps to filter sig_info file.
      -plate_id PLATE_ID    Optional: Will only look at signatures from this plate
      -ref_allele_mode      Sparkler+Viz: Instead of organizing plots by gene,
                            will use the wt column to determine what are the
                            reference alleles.
      -x_thresh X_THRESH    Sparkler: Threshold of significance
      -y_thresh Y_THRESH    Sparkler: Threshold of impact direction
      -annotate             Sparkler: Will add allele labels to points.
      -by_gene_color BY_GENE_COLOR
                            Sparkler: File containing labels and colors for gene-
                            centric plot.
      -pdf PDF              Sparkler + Viz: Will print plots in pdf format instead
                            of png.
      -xmin XMIN            Sparkler: Min value of x-axis. DEF=0
      -xmax XMAX            Sparkler: Max value of x-axis. DEF=4
      -ymin YMIN            Sparkler: Min value of y-axis. DEF=-3
      -ymax YMAX            Sparkler: Min value of y-axis. DEF=3
      -viz_ymin VIZ_YMIN    Viz: Minimum y-value of rep value. DEF=-100
      -viz_ymax VIZ_YMAX    Viz: Maximum y-value of rep value. DEF=100
      -corr_val CORR_VAL    Viz: String used to label the correlation value. DEF=
                            'row median rankpoints'
      -eVIPP                Use this option when doing pathway analysis, must also
                            have JSON file
      -JSON JSON            JSON file created by create_pathway_JSON.py. Contains
                            dictionary of pathways and the associated ids
      -gmt GMT              Gene set file in .gmt format
      -min_genes MIN_GENES  Minimum amount of pathway genes found in data to run
                            eVIPP on. DEF = 5
      -viz_off              Will not perform eVIP viz step
      -sparkler_off         Will not perform eVIP sparkler step
      -input_dir INPUT_DIR  Path to directory of kallisto outputs
      -gtf GTF              Gtf file used to convert transcript counts to gene
                            counts
      -control CONTROL      If multiple controls in the controls file, designate
                            which to use for deseq2
This tutorial recreates the eVIP2 results presented in Thornton et al. 2021
Clone the eVIP2 repo to the desired path on your machine: git clone https://github.com/BrooksLabUCSC/eVIP2.git
Pull the Docker container: docker pull althornt/evip2_env
Enter the Docker container: docker run -v /path/to/eVIP2:/eVIP2 -ti althornt/evip2_env
The Docker container contains all the files needed to run the tutorial command below in docker_tutorial_files. Alternatively, tutorial_files/setup.sh downloads the abundance.tsv files from GEO and formats into the original kallisto output directory structure and a gtf file can be downloaded from ensembl usinig wget http://ftp.ensembl.org/pub/release-87/gtf/homo_sapiens/Homo_sapiens.GRCh38.87.gtf.gz -P tutorial_files/
cd eVIP2
python2 run_eVIP2.py -input_dir ../docker_tutorial_files/RNF43_kallisto_outputs -out_directory tutorial_files/eVIP2_out -sig_info tutorial_files/RNF43_sig.info -c tutorial_files/controls.grp -r tutorial_files/comparisons.tsv -by_gene_color tutorial_files/RNF43_gene_label.tsv -gmt tutorial_files/h.all.v6.0.symbols.gmt -gtf ../docker_tutorial_files/Homo_sapiens.GRCh38.87.gtf -num_reps 4 -x_thresh 1.3 -y_thresh 1.3 -ymin -2 -ymax 4 -use_c_pval -eVIPP
Tutorial output for mutation-specific pathways in RNF43 G659fs (eVIP2/tutorial_files/eVIP2_out/eVIPP_out/RNF43_G659fs/mutation_specific/eVIPP_sparkler_plots/RNF43_G659fs_spark_plots.png):
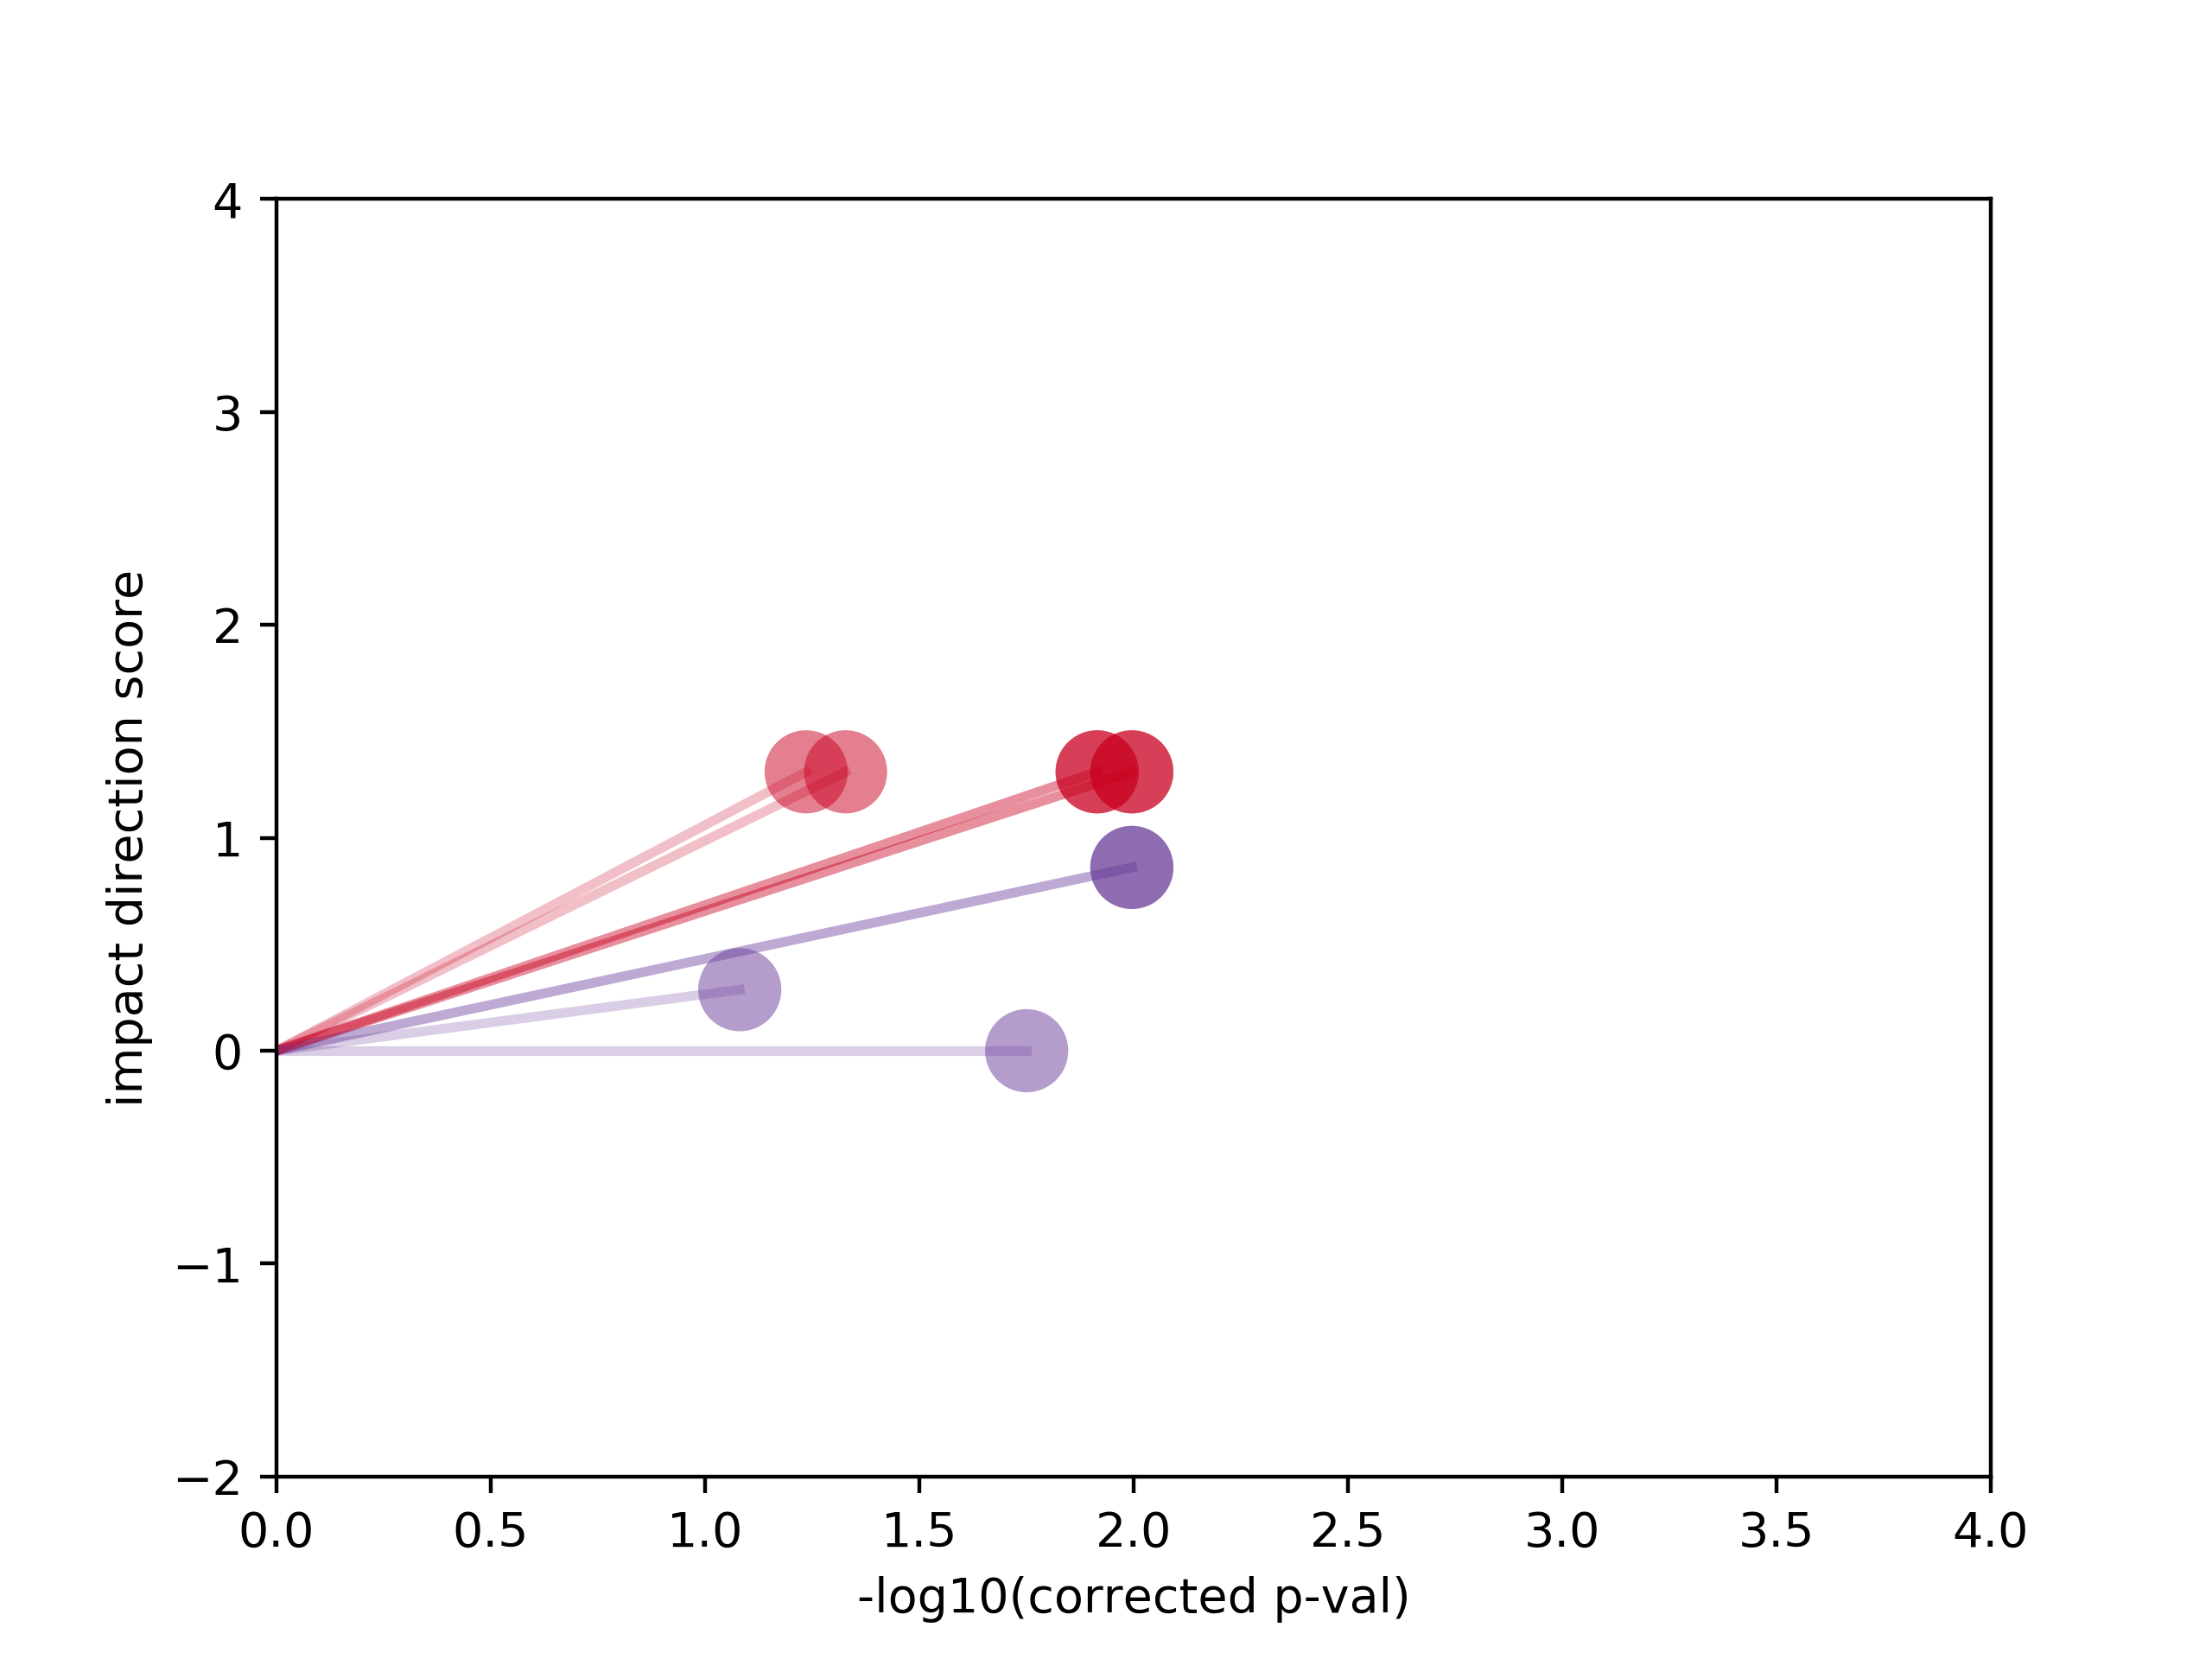
eVIP2 also creates interactive sparkler plots to visualize the
overall mutation results
and the pathway results per mutation. The html files can be found in eVIP2/tutorial_files/eVIP2_out/

eVIP art by Cindy Liang (Cindy's twitter)