This project is meant to help out the charity, A Million Thanks Inc., capture addresses from pictures of the mails they receive, creating a database to store the addresses and creating a web user interface to search and view statistics about all the senders. To help out we created a website that has these features. Our website consists of two main parts: The mail upload web pages and the statistics web pages.
There are two mail upload related web pages: Mail Upload page and the Change Data page. The mail upload page is where the user can upload pictures from their computer through drag ‘n’ drop or by going through their file system and selecting the pictures. In the change data page a user can update any addresses in case any of the addresses extracted were inaccurate.
There are three statistics related web pages: Mail Sender Heatmap, National Stats and Location Stats. In the heatmap a person can view all the locations of the mail sent in through a map with a heatmap layer, where heat points are placed on locations where the mail was sent from. In the national stats page, one can see a collection of data on a national scale. Such as, the amount of mail sent in nationally across the US, the top 5 states/cities/date, and more. In the location stats page, one can search for an address or city and receive a graph with the amount sent from there over certain timeframes and a table with the addresses and the dates of the mail sent in.
Using the below code to download the code to local.
git clone https://github.com/CS-UCR/homeless-baby-bear.git
Before we set up the environment, you should download the credentials from both Google Cloud Platform and MongoDB Atlas.
- Google Cloud Platform:
We are using GCP to manage our Google Text Detection (Handwriting) API and Google Geocoding API utilities.
Create a project and adding a payment method to create a credential. https://cloud.google.com/
Follow the instruction in this page below to create a google cloud platform account and getting an credential (server account key (Make sure you have downloaded the api key)) for that: https://cloud.google.com/vision/docs/quickstart-client-libraries
After you getting the API key above, let's get another API key which is for google map apis. Go and follow the instruction from the link below's under the "Get the API key" title and getting another API key for google MAP. https://developers.google.com/maps/documentation/geocoding/get-api-key
After getting the credential, go back to the google cloud platform page's API page and enable Google Vision API, geocoding API.


Text Detection API is free for first 1000 requests. Then it will charge $1.5 per month within 5 million requests.
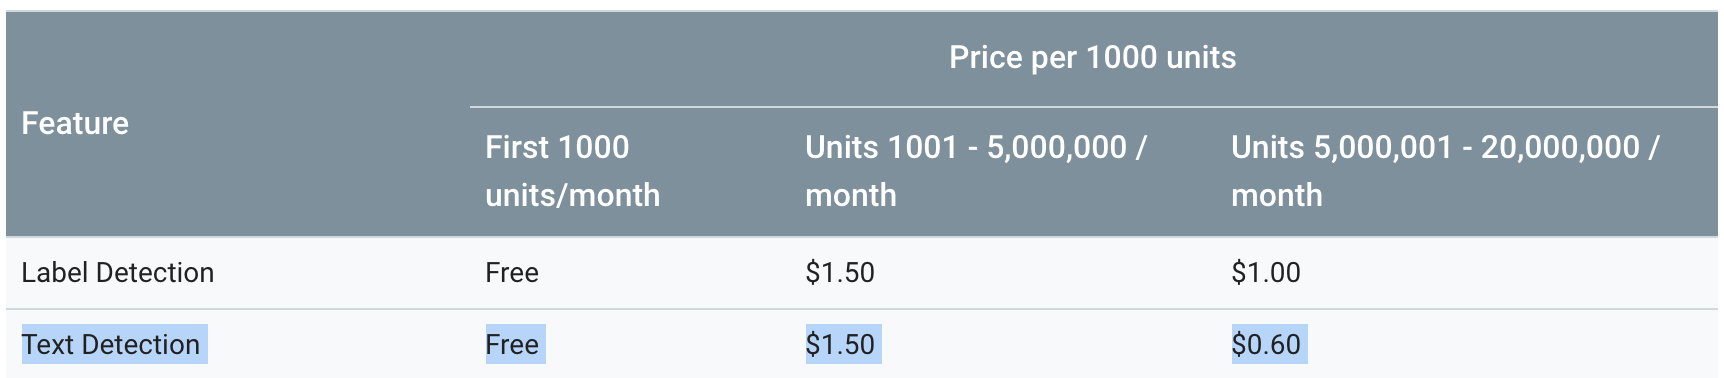
See more details: https://cloud.google.com/vision/pricing
Geocoding API is $0.005 per request ($5 for 1000 requests). However, google gives everyone up $200 credits each month. In other words, first 40,000 requests are free each month.
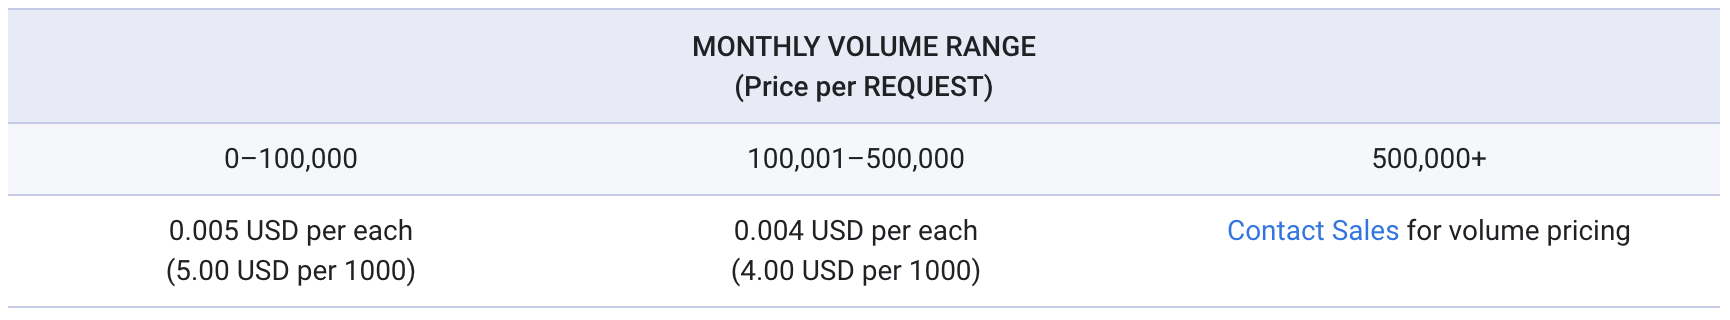
See more details: https://developers.google.com/maps/documentation/geocoding/usage-and-billing
- MongoDB Atlas.
We are using MongoDB Atlas as our database.
https://www.mongodb.com/cloud/atlas
They provide 500MB free storage and do not require a credit card.
Create a Clusters (sandbox) and click the "Connect" button and choose "Connect your application".
Then, choose node.js as your driver with 3.0 or later version.
An application code will show on the bottom with the format:
mongodb+srv://<username>:<password>@cluster*-*****.mongodb.net/test?retryWrites=true&w=majority
Copy it and replace the username and password, and it will be your credential.
Note: Don't forget add your IP address to the left side Security/Network Access, or you will see the error when connecting database.
Once you get three credentials, put your GCP API key and database key on backend/.env file and copy your GCP server account content to backend/google_credential.json file.
If you haven't download npm & node.js, go to the link below and follow the instruction download and install the npm and nodejs
https://nodejs.org/en/
To run the Web Interface, you should download the dependencies by doing “npm install” in three locations:
- homeless-baby-bear
npm install
- homeless-baby-bear/client
cd client
npm install
- homeless-baby-bear/backend
cd ../backend
npm install
##Then, let's go back to the root folder (homeless-baby-bear) to run the program on port 3000 and RESTful APIs on port 4001.
cd ..
npm start
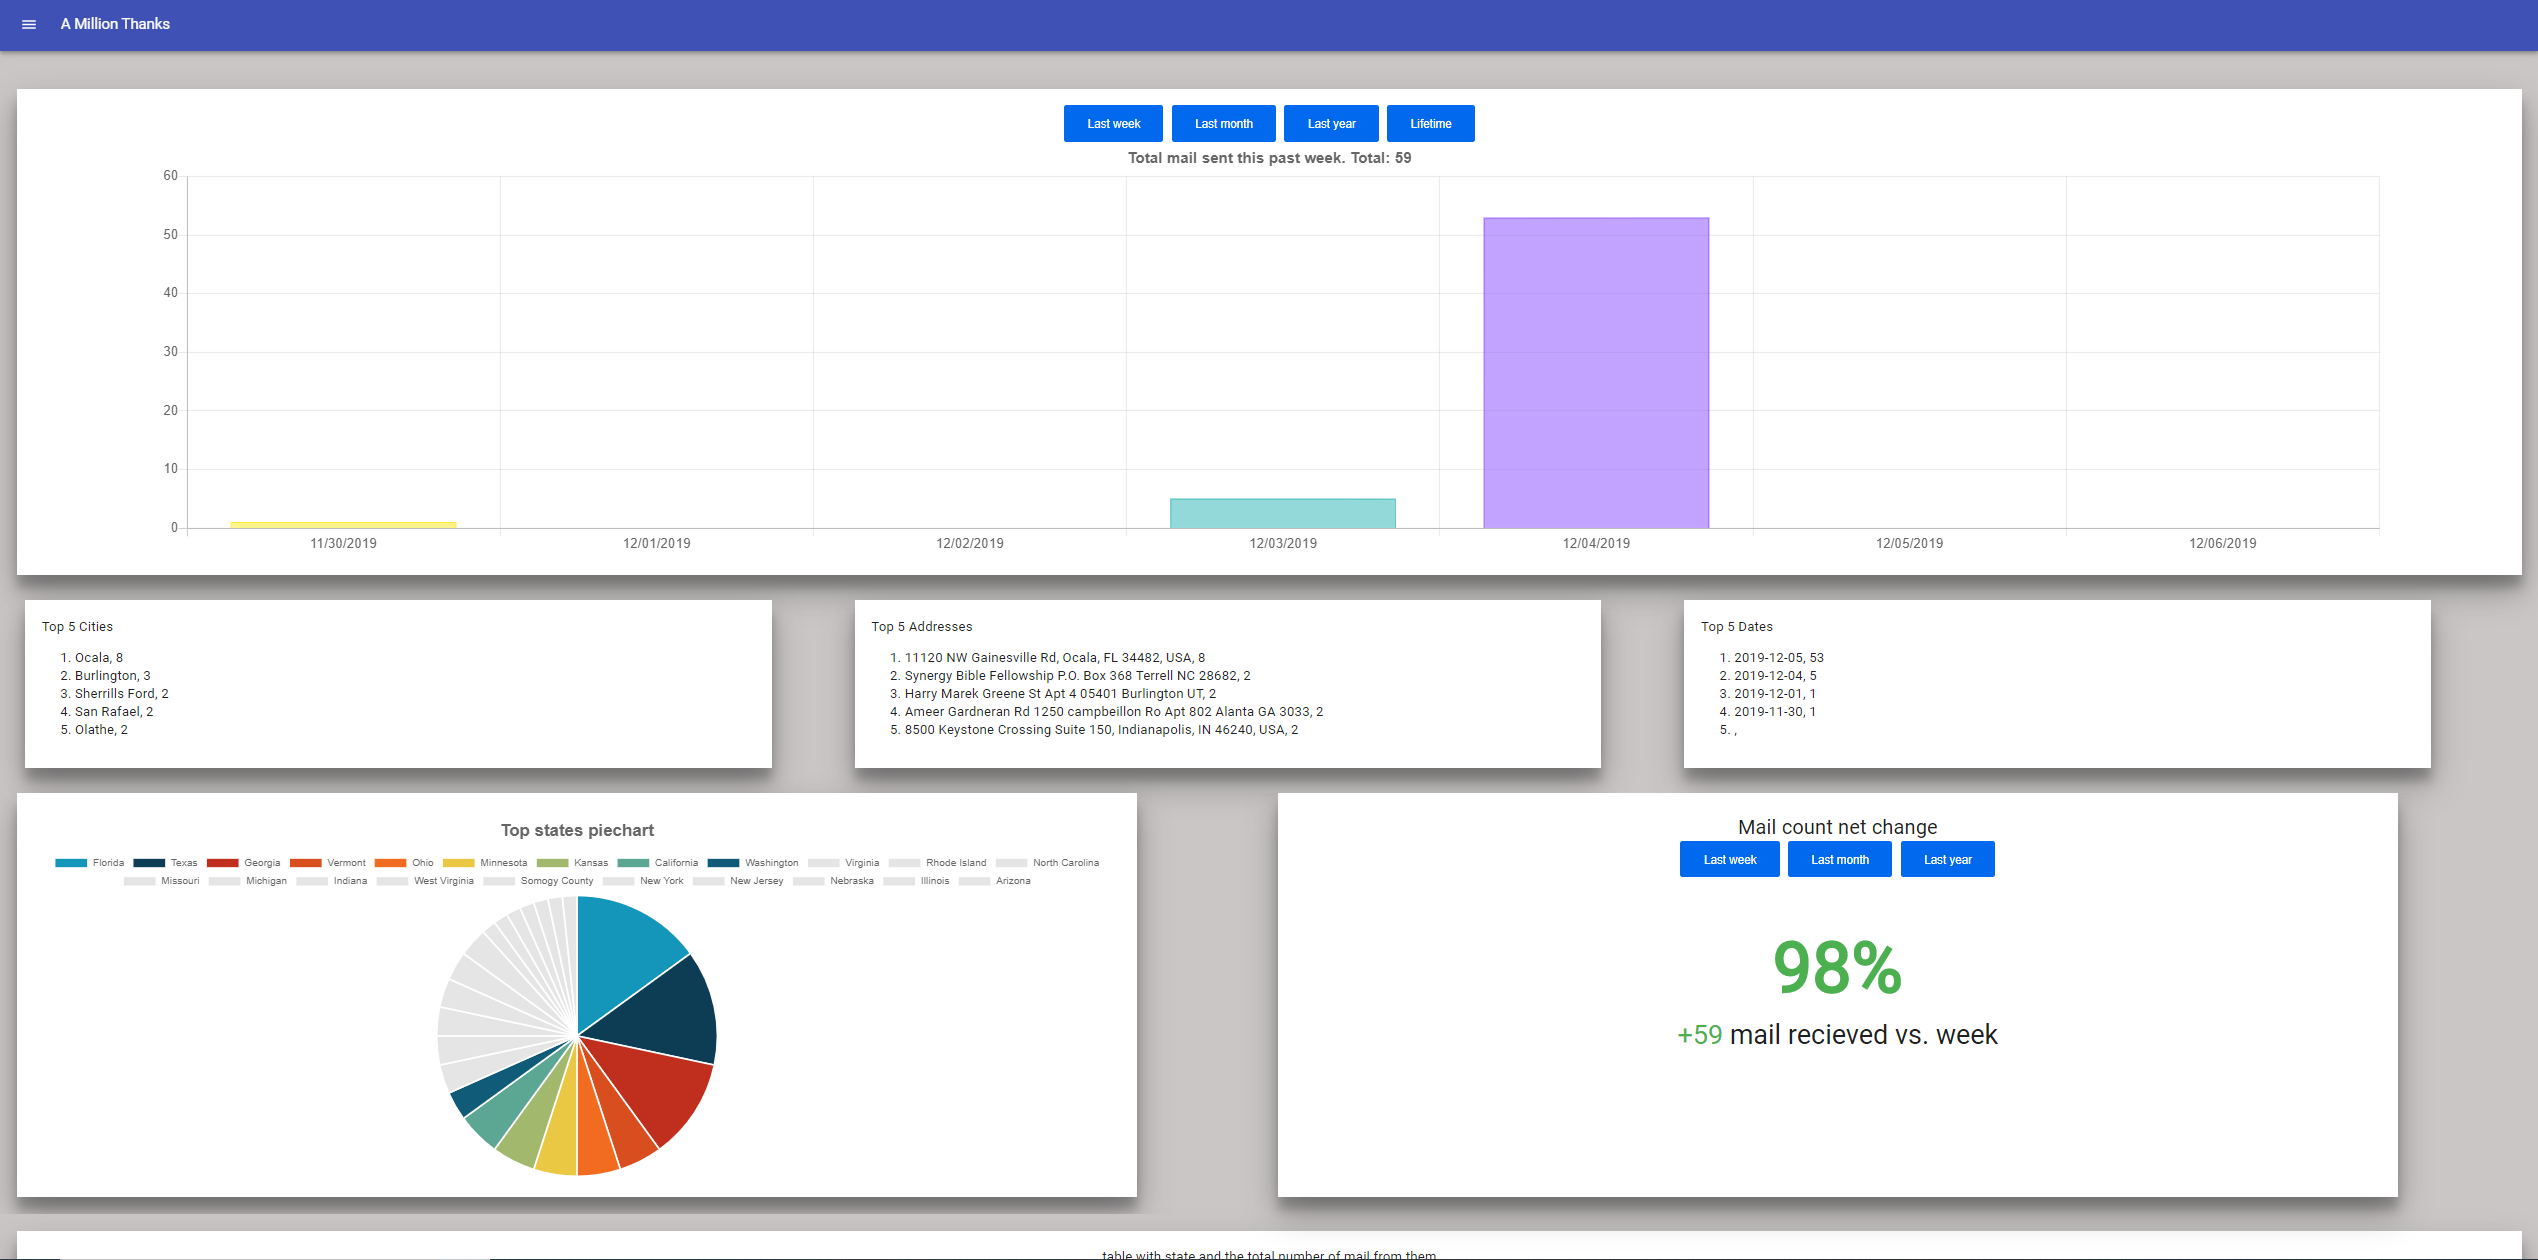
The dashboad shows the upload history and the statistics information.
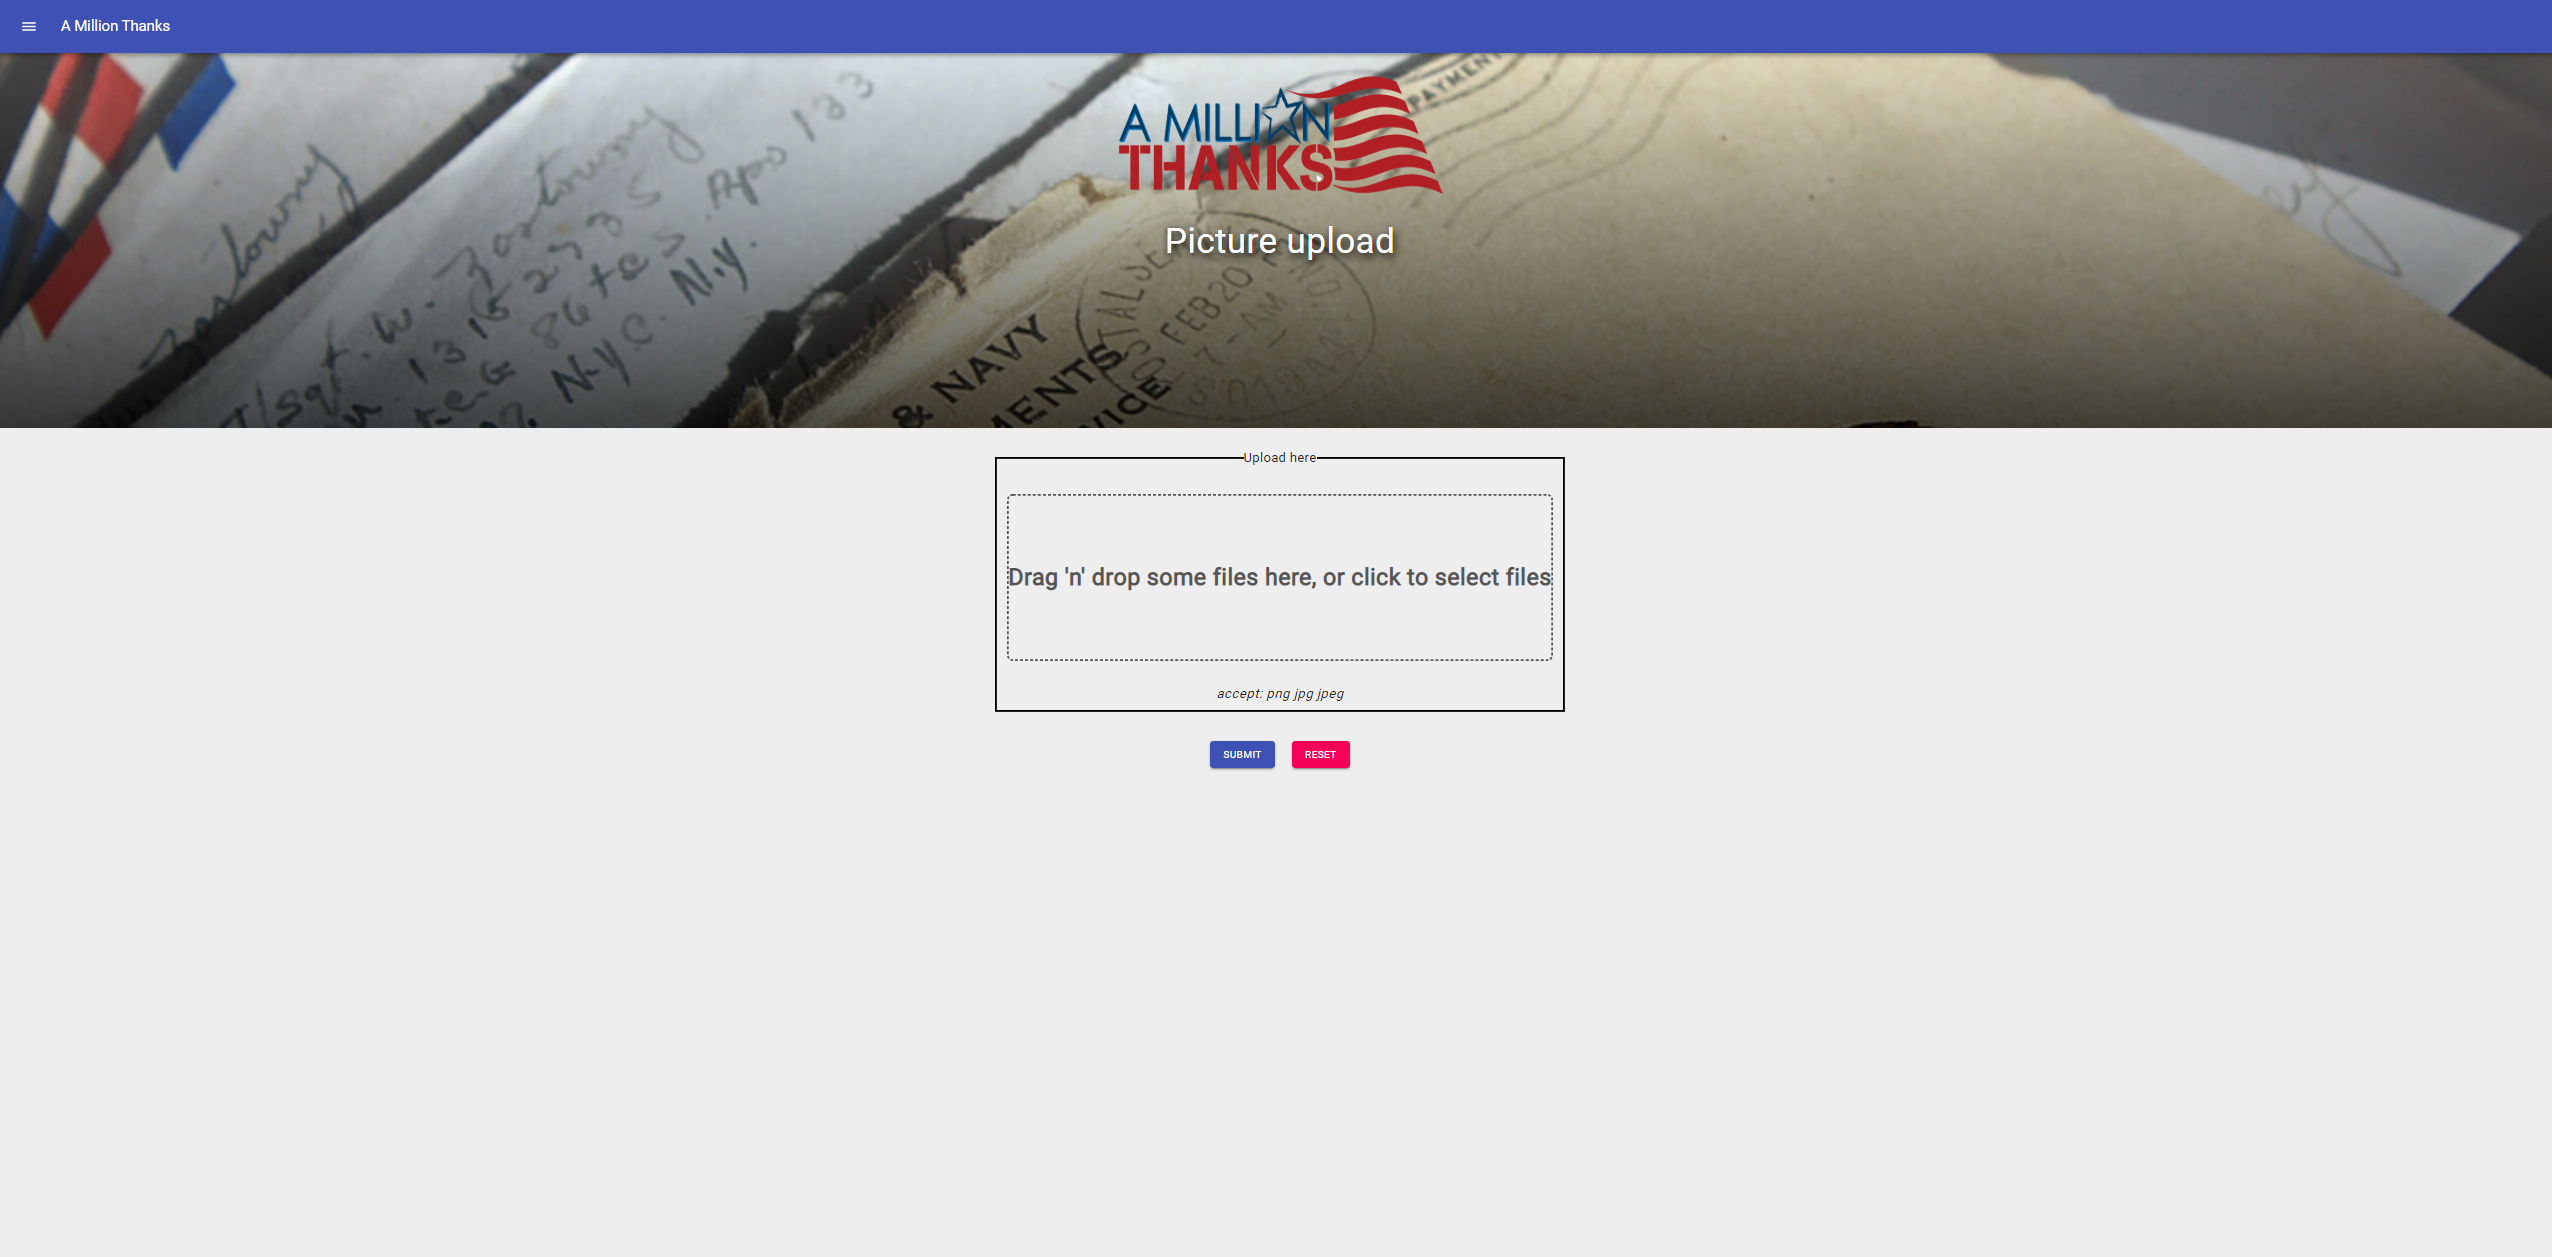
The upload page allow user to upload multiple pictures in one time.
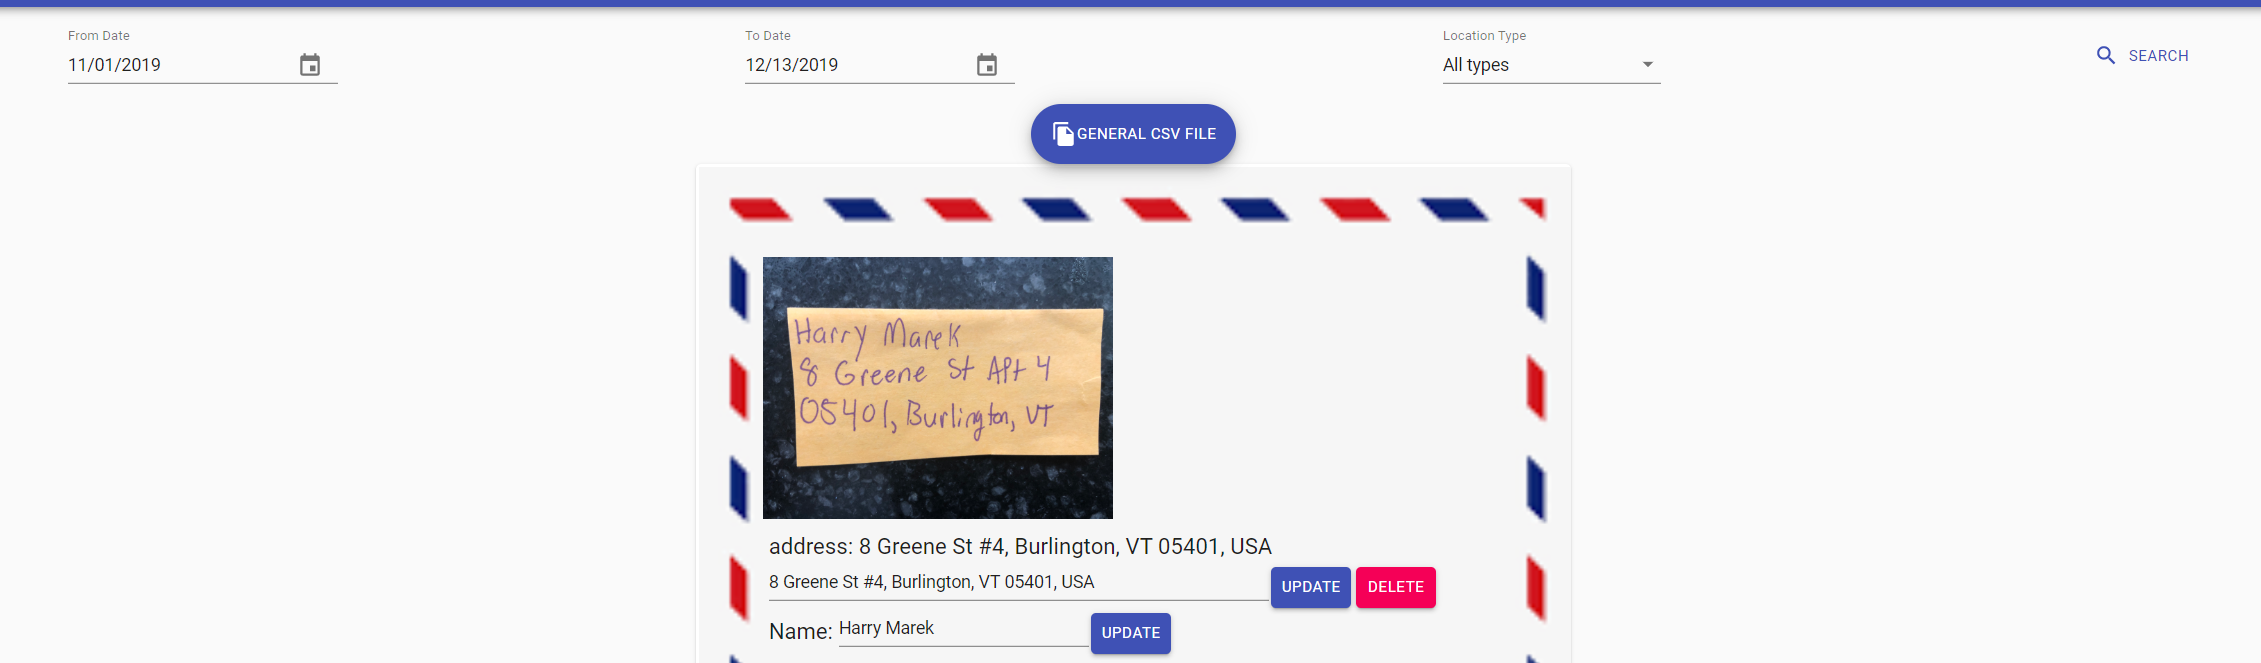
The Changing data page allow user to view, delete, and correct the picture infomation from database.
The user can seach by date and the location type which returned by Google API. Rooftop address is 100% correct. Geometric center, range interpolated, and approximate address needs to be correct by user. Once the address is found and correct, it will move to rooftop category. Unknown address is returned by sever and cannot distinguish the address. P.O. Box is a special category because it does not contain the street number. Once we find "P.O. Box" on the picture, it will move to P.O. Box category.
In addition, it allows user to download the current page information in one click to a .csv file.

Heatmap page shows the whole database address and convert to dots in one page.
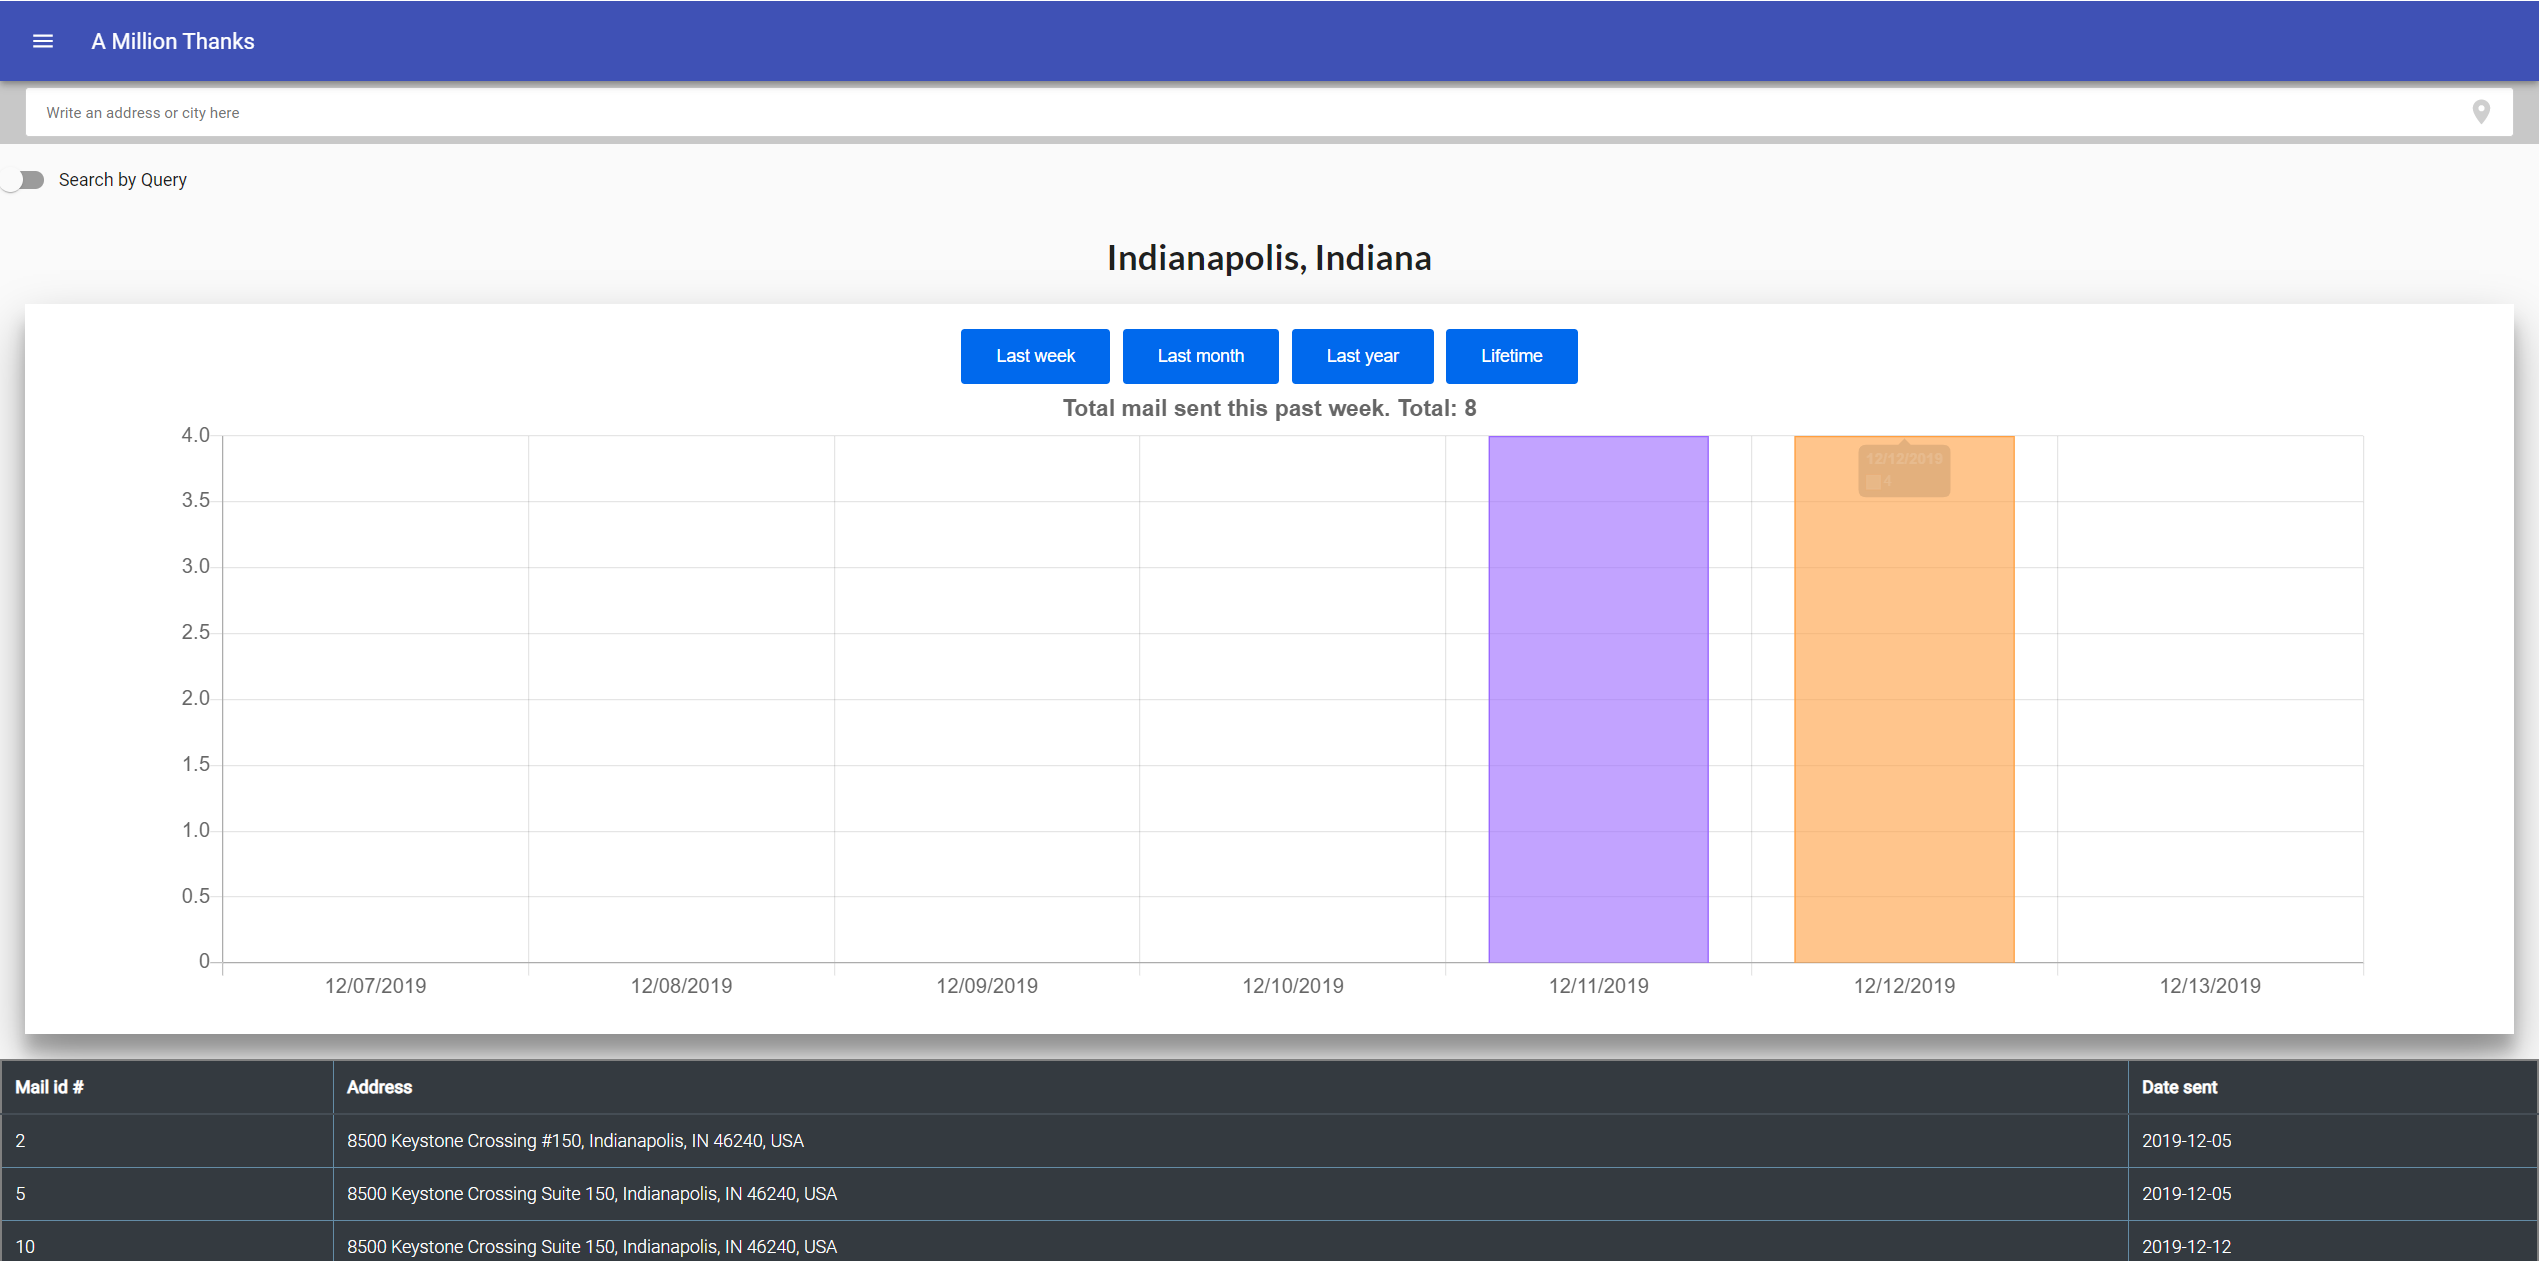
Location statistics page allows user to search the address information by city or query. Then, it will shows the address information on the bottom and the histogram.
https://cloud.google.com/vision/docs/handwriting#vision-document-text-detection-nodejs
https://docs.mongodb.com/manual/
https://developers.google.com/maps/documentation/geocoding/start
https://codepen.io/Ushinro/pen/NPQzOx
https://www.chartjs.org/docs/latest/
https://demo.dashboardpack.com/architectui-react-free/#/dashboards/basic
https://medium.com/better-programming/build-a-responsive-modern-dashboard-layout-with-css-grid-and-flexbox-bd343776a97e
https://medium.com/javascript-in-plain-english/full-stack-mongodb-react-node-js-express-js-in-one-simple-app-6cc8ed6de274
https://material-ui.com/
https://developers.google.com/maps/documentation/javascript/get-api-key
Jia Xie: Google Picture Upload function of backend. Picture Upload, Dashboard, Heatmap, and Location Stats intergration between front-end and backend. Tried Google Geocoding API and Google Cloud Vision API.
Xichao Wang: Database management and all the backend stuff except picture upload. Changing data intergration between front-end and backend. Tried UPS Address Validation Street Level API.
Marcos Leandro: Initial design of the user interface. Heatmap and location stats front-end. Tried Microsoft Azure API.
Zelai Wang: Picture upload of front-end. Changing data front-end. Tried Amazon Textract API.