This project is now LEGACY and not supported - we recommend using our Grafana-Athena integration.
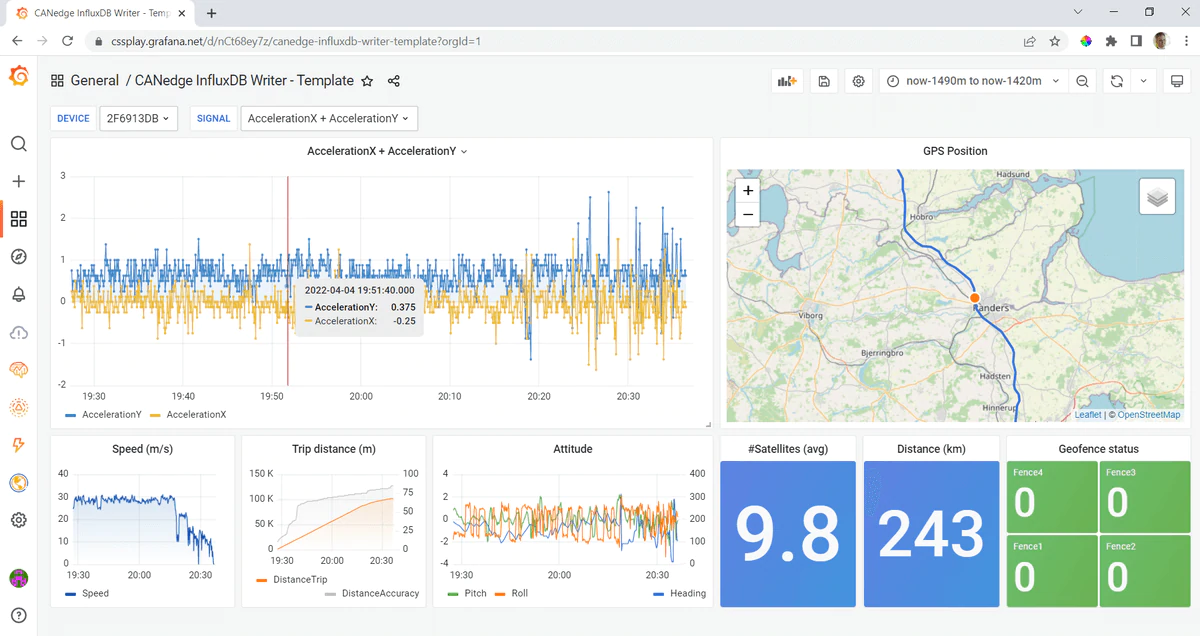
This project lets you DBC decode CAN data from your CANedge CAN/LIN data logger - and push the data into an InfluxDB database. From here, the data can be visualized in your own customized, open source Grafana dashboards.
For the full step-by-step guide to setting up your dashboard, see the CANedge intro.
We provide two options for integrating your CANedge data with Grafana dashboards:
The CANedge Grafana Backend app only processes data 'when needed' by an end user - and requires no database. It is ideal when you have large amounts of data - as you only process the data you need to visualize.
The CANedge InfluxDB Writer processes data in advance (e.g. periodically or on-file-upload) and writes the decoded data to a database. It is ideal if dashboard loading speed is critical - but with the downside that data is processed/stored even if it is not used.
For details incl. 'pros & cons', see our intro to telematics dashboards.
- easily load MF4 log files from local disk or S3 server
- fetch data from hardcoded time period - or automate with dynamic periods
- DBC-decode data and optionally extract specific signals
- optionally resample data to specific frequency
- optionally process multi-frame CAN data (ISO TP), incl. UDS, J1939, NMEA 2000
- write the data to your own InfluxDB time series database
In this section we detail how to deploy the app on a PC.
Note: We recommend to test the deployment with our sample data as the first step.
- Install Python 3.9.13 for Windows (32 bit/64 bit) or Linux (enable 'Add to PATH')
- Download this project as a zip via the green button and unzip it
- Open the folder with the
requirements.txtfile - Open
inputs.pywith a text editor and add your InfluxDB Cloud details - Double click the
install.bat(Windows) or open your command prompt and enter below:
python -m venv env & env\Scripts\activate & pip install -r requirements.txt
python3 -m venv env && source env/bin/activate && pip install -r requirements.txt
- Double-click
main.bat(Windows) or open your command prompt and enter below:
env\Scripts\activate & python main.py
env/bin/activate && python3 main.py
- In
Configuration/PluginsinstallTrackMap - In
Dashboards/BrowseclickImportand load thedashboard-template-sample-data.jsonfrom this repo - Use the date/time browser to display the last 7 days
You should now see the sample data visualized in Grafana.
Note: To activate your virtual environment use env\Scripts\activate (Linux: source env/bin/activate)
- Replace the sample
LOG/folder with your ownLOG/folder - Verify that your data is structured as on the CANedge SD card i.e.
[device_id]/[session]/[split].MF4 - Add your DBC file(s) to the
dbc_filesfolder - Update
devicesanddbc_pathsininputs.pyto reflect your added log and DBC files - Set
days_offset = Noneto ensure your data is written at the correct date - Run the script via the
main.bat
Note: If you're using the free InfluxDB Cloud, there is a limit of 200 unique signals per device - make sure to add a filtered list of signals inputs.py or modify your DBC file to contain less than the limit.
- Add your DBC file(s) to the
dbc_filesfolder - Update
dbc_pathsininputs.pyto reflect your added log and DBC files - Update
devicesininputs.pyto reflect your S3 structure i.e.["your_bucket/device_id"] - Set
days_offset = Noneto ensure your data is written at the correct date - Update the S3 details in
inputs.pywith your S3 server and sets3 = True - Run the script via the
main.bat
Note: You may want to modify other variables like adding signal filters, changing the resampling or modifying the default start date.
- In
Dashboards/BrowseclickImportand load thedashboard-template-simple.jsonfrom this repo - Select a time period and signal with data to verify that your own data displays as expected
- After this, you can optionally start customizing your panels as explained in the CANedge Intro
Once you've verified that your data is uploaded correctly, you can move on to automating it. See the CANedge intro for details.
We recommend to see the README in deploy-aws-lambda/ of this repo for automation via AWS Lambda functions.
If you need to delete data in InfluxDB that you e.g. uploaded as part of a test, you can use the delete_influx(name) function from the SetupInflux class. Call it by parsing the name of the 'measurement' to delete (i.e. the device ID): influx.delete_influx("958D2219")
You can easily process multi-frame data by setting the tp_type variable to "j1939", "uds" or "nmea" and adding the relevant DBC file. For example, you can test this for the sample data by adding the DBC "dbc_files/nissan_uds.dbc" and setting tp_type = "uds".
Note that if you use the paid InfluxDB cloud and a paid S3 server, we recommend that you monitor usage during your tests early on to ensure that no unexpected cost developments occur.