using one graph template, same data is being shown in different devices #3458
Labels
Comments
|
Yea I reported something similar to this are you using multiple poller?
For me it's cacti stats showing the same info for all my pollers
…On Sun., Apr. 12, 2020, 10:41 p.m. Karlo Bonayon, ***@***.***> wrote:
Bug description:
Server 1 disk usage: 20%
Server 2 disk usage: 14%
Created a custom bash script to get disk usage of a Linux server. Created
a graph template using the bash script, then created 2 devices (Server 1
and Server 2) with the same graph template. Upon checking the disk usage of
the 2 devices, they have the same value: 20%.
Steps to reproduce:
1. Create a Data Input Method using the bash script to get disk usage
of a Linux server.
2. Create a Data Source using the Data Input Method created in Step 1.
3. Create a Graph Template using the Data Source created in Step 2.
4. Create 2 devices.
5. Assign the Graph Template created on Step 3 to the 2 devices
created in Step 4. (This will create a graph for each device. e.g. "Server
1 - Disk usage", "Server 2 - Disk usage")
6. Create 2 Trees.
7. Add the 2 graphs (generated on Step 5) to the appropriate trees.
8. Check the value of the graphs.
Expected behavior
I'm not quite sure how Cacti uses the custom script I created, but I think
Cacti will execute the script on Server 1 and graph the result, then
execute the script on Server 2, then graph the result. Thus, the 2 graphs
should have different results.
Screenshots
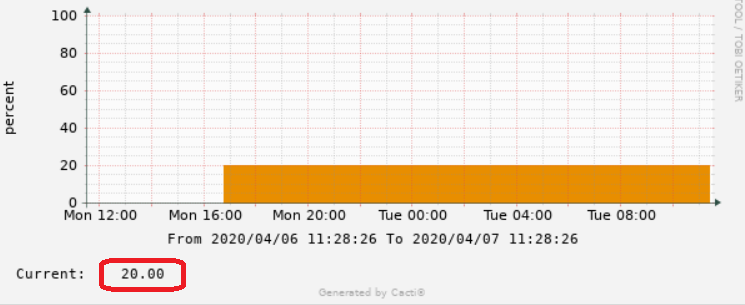
Server 1 Disk usage graph:
[image: cacti1]
<https://user-images.githubusercontent.com/24322960/79087659-95220580-7d72-11ea-9ed9-3279295ac864.png>
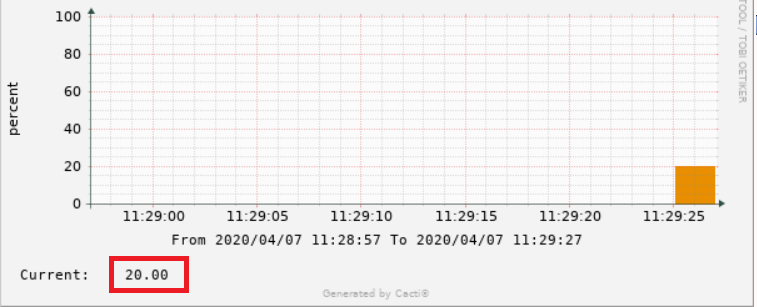
Server 2 Disk usage graph:
[image: cacti2]
<https://user-images.githubusercontent.com/24322960/79087683-ab2fc600-7d72-11ea-9fa6-a5de1ac5e18f.png>
System Info
Cacti Version: 1.2.10 (Docker Image)
OS: Ubuntu 18.04
Browser: Google Chrome
—
You are receiving this because you are subscribed to this thread.
Reply to this email directly, view it on GitHub
<#3458>, or unsubscribe
<https://github.com/notifications/unsubscribe-auth/ADGEXTBVLZO623ZCVRGMQSLRMJ3UPANCNFSM4MGVJJZQ>
.
|
|
I only have 1 poller, but I have 2 devices, and the graphs for those 2 devices are displaying the same value |
|
A "bash script" will only ever be executed on the Cacti server. It isn't going to copy it over to any server and execute it. That is not how Cacti works. |
|
You should instead be using SNMP data to get Disk Space graphs on Linux/ |
|
Oh, right. I thought the bash script will be executed on multiple servers. Thanks for the clarification! |
Sign up for free
to subscribe to this conversation on GitHub.
Already have an account?
Sign in.
Bug description:
Server 1 disk usage: 20%
Server 2 disk usage: 14%
Created a custom bash script to get disk usage of a Linux server. Created a graph template using the bash script, then created 2 devices (Server 1 and Server 2) with the same graph template. Upon checking the disk usage of the 2 devices, they have the same value: 20%.
Steps to reproduce:
Expected behavior
I'm not quite sure how Cacti uses the custom script I created, but I think Cacti will execute the script on Server 1 and graph the result, then execute the script on Server 2, then graph the result. Thus, the 2 graphs should have different results.
Screenshots
Server 1 Disk usage graph:
Server 2 Disk usage graph:
System Info
Cacti Version: 1.2.10 (Docker Image)
OS: Ubuntu 18.04
Browser: Google Chrome
The text was updated successfully, but these errors were encountered: