
rnoaa is an R package with a set of functions that makes easier to analyze the earthquake data provided by the U.S. National Oceanic and Atmospheric Administration (NOAA).
# Install the package from GitHub without the vignette:
devtools::install_github("Cesar-Urteaga/rnoaa")

# Or you can include it:
devtools::install_github("Cesar-Urteaga/rnoaa", build_vignettes = TRUE)This package allows you to get and clean the latest earthquake data from the NOAA's Webpage so as to prepare it for analysis:
library(rnoaa)
library(dplyr)

# GETTING THE DATA
#   In case you do not have internet access, you can use the get_earthquake_data
#   function, which is a snapshot of the quake's data on September 10, 2017:
#   raw_data <- get_earthquake_data()
raw_data <- download_earthquake_data()

# TIDYING THE DATA UP
#   Before the data has been processed:
set.seed(48)
raw_data %>%
  select(YEAR, MONTH, DAY, COUNTRY, LOCATION_NAME) %>%
  sample_n(6)
> # A tibble: 6 x 5
>    YEAR MONTH   DAY     COUNTRY                          LOCATION_NAME
>   <int> <int> <int>       <chr>                                  <chr>
> 1  1946     8     2       CHILE                       CHILE:  NORTHERN
> 2   778    NA    NA       CHINA CHINA:  HUNAN PROVINCE: HOANG KIN CHAN
> 3  -426     6    NA      GREECE                        GREECE:  EUBOEA
> 4  1885     1    14       CHINA                 CHINA:  GANSU PROVINCE
> 5  1802    12     9       JAPAN   JAPAN:  NW HONSHU:  SADO ISLAND, OGI
> 6  1576     5    23 EL SALVADOR               EL SALVADOR:  SAN MARCOS
#   We use the two rnoaa's functions to clean the data.
clean_data <- raw_data %>%
  eq_clean_data() %>%
  eq_location_clean()
#   After the data has been processed (note that the DATE variable has been
#   created and the country has been removed for the LOCATION_NAME variable):
set.seed(48)
clean_data %>%
  select(YEAR, MONTH, DAY, DATE, COUNTRY, LOCATION_NAME) %>%
  sample_n(6)
> # A tibble: 6 x 6
>    YEAR MONTH   DAY       DATE     COUNTRY                  LOCATION_NAME
>   <int> <int> <int>     <date>       <chr>                          <chr>
> 1  1946     8     2 1946-08-02       CHILE                       Northern
> 2   778    NA    NA  778-07-02       CHINA Hunan Province: Hoang Kin Chan
> 3  -426     6    NA -426-06-15      GREECE                         Euboea
> 4  1885     1    14 1885-01-14       CHINA                 Gansu Province
> 5  1802    12     9 1802-12-09       JAPAN    Nw Honshu: Sado Island, Ogi
> 6  1576     5    23 1576-05-23 EL SALVADOR                     San Marcos
#   N.B.: When the month or/and day is/are missing, the date is approximated
#         at the midpoint of the period.
Once the data was tidied, rnoaa includes two ggplot2's geoms to visualize the timeline in which the quakes have ocurred and label the ones with the greatest magnitude:
library(ggplot2)
clean_data %>%
  filter(COUNTRY %in% c("CANADA", "USA", "MEXICO",
                        "CHINA", "JAPAN", "INDIA"),
         !is.na(EQ_PRIMARY),
         YEAR %in% 2000:2016) %>%
  ggplot(mapping = aes(x = DATE,
                       y = COUNTRY,
                       size = EQ_PRIMARY,
                       color = TOTAL_DEATHS / 1000,
                       label = LOCATION_NAME)
         ) +
  geom_timeline() +
  geom_timeline_label(# We want to show the label for at most the two highest
                      # earthquakes by size.
                      n_max = 2,
                      line_height = 1 / 4,
                      angle = 10,
                      fontsize = 2.5) +
  labs(size = "Richter scale value",
       color = "# deaths in thousands",
       y = "") +
  guides(size = FALSE) +
  theme_timeline()
Furthermore, it provides with functions to display the epicenters in an interactive R leaflet map:
clean_data %>%
  dplyr::filter(COUNTRY == "JAPAN" & lubridate::year(DATE) >= 2000) %>%
  eq_map(annot_col = "DATE")
Also, it assists you to display the quake's traits from the data using popup text labels:
clean_data %>%
  dplyr::filter(COUNTRY == "MEXICO" & lubridate::year(DATE) == 2017) %>%
  dplyr::mutate(popup_text = eq_create_label(.)) %>%
  eq_map(annot_col = "popup_text")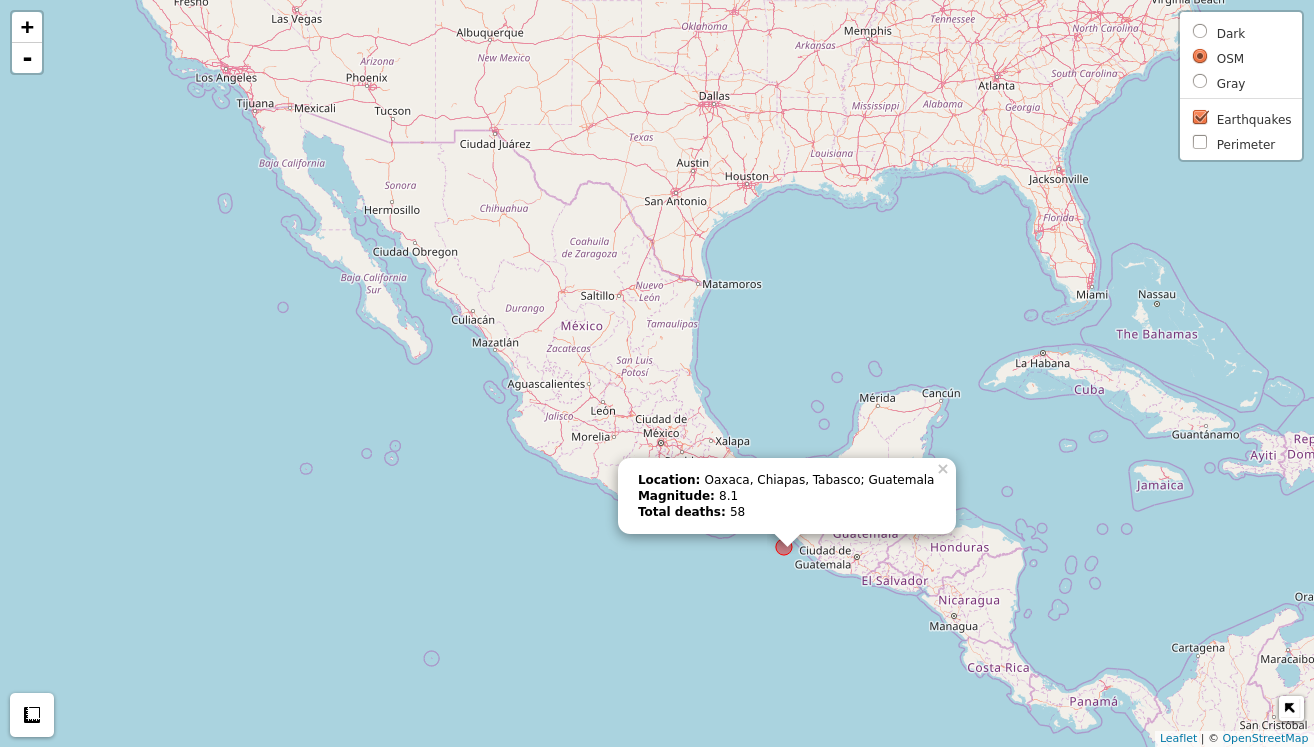
Please check the package's vignette to see how the package works or review the examples given in the package's documentation (use ?function_name); you can run them with the function example (e.g., example("geom_timeline_label")).
In order to increase the quality of the package, a test suite was carried out for each function using the testthat R package. I have added a code coverage measure to the package's repository using codecov.
The workflow that was used to develop this package is described here.