MATLAB source code for the paper:
A data-driven framework for selecting and validating digital health metrics: use-case in neurological sensorimotor impairments. Christoph M. Kanzler, Mike D. Rinderknecht, Anne Schwarz, Ilse Lamers, Cynthia Gagnon, Jeremia Held, Peter Feys, Andreas R. Luft, Roger Gassert, Olivier Lambercy. npj Digital Medicine, 3, 80 (2020). https://www.nature.com/articles/s41746-020-0286-7
This code will simulate data for multiple digital health metrics for a reference (e.g., neurologically intact) and a target (e.g., neurologocially impaired) population. Based on these data, the proposed multi-step metric selection framework will be applied and all evaluation criteria and plots from the paper will be generated.
This approach is expected to be applicable for any 1D, discrete digital health metric for that data for a reference (e.g., neurologically intact) and target (e.g,. neurologically impaired) population is available. Also, one of these populations should have test-retest data available as well.
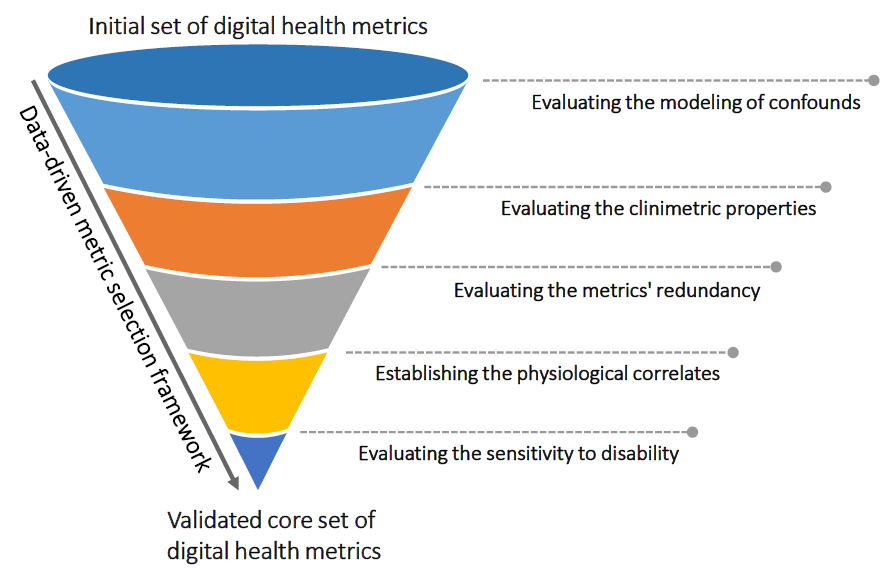
The framework allows the selection of robust metrics that have highest potential for repeatedly assessing impairments based on discriminant validity, test-retest reliability, measurement error, learning effects, and inter-metric correlations.
This code requires MATLAB and the following toolboxes.
- Statistics and Machine Learning Toolbox
- Financial Toolbox
To run the analysis with the default simulated data, simply run the metric_selection_framework function without arguments. The framework can also be used for feature selection using another data-set, and some parameters can be tweaked.
To run the feature selection on your data, you should make sure it meets the following requirements.
- For each subject, the data-set should include a test and a re-test measurement of all the features you want to perform selection on.
- Single measurements of a feature should consist of scalars.
- If you want to perform confound correction using a linear mixed-effect model, the variables used to fit the model should be included in the data-set.
- Your data should contain a group of healthy subject, used as reference, and the set of impaired patients.
- If you want to run the sub-population analysis on the disease severity (Further metric validation: step 2), you should include a column named
disease_severitythat specifies the severity of the disease with labels.
The resulting data-set should consist of two separate MATLAB tables, one for the healthy and one for the patients. Assume you want to run feature selection on a set of N features with names f1, f1, f2, ..., fN, and perform confound correction with M effects with names e1, e2, ..., eM. Both tables should have the same structure, depicted in the following scheme.
| Unique ID | e1 | ... | eM | f1 | f1_retest | ... | fN | fN_retest | disease_severity |
|---|---|---|---|---|---|---|---|---|---|
| 1 | ... | ... | ... | ... | ... | ... | ... | ... | "low" |
| 2 | ... | ... | ... | ... | ... | ... | ... | ... | "high" |
| ... | ... | ... | ... | ... | ... | ... | ... | ... | ... |
Please make sure to add the _restest suffix on the column names of the re-test measurements of each feature!
Then, to use the code with your data you should set the following name-value arguments of the metric_selection_framework function.
ReferenceTableandImpairedTableshould be set to the tables containing the data for the healthy and patients group, respectively.Metricsshould be a cell or string array with the names of all the metrics you want to run the selection on (f1, f2, ..., fN).Effectsshould be a cell or string array with the effects you want to run the confound compensation with (e1, e2, ..., eM).
The complete call would then look similar to the following.
[ref_table, impaired_table, metric_scores, partialcorrs, factor_analysis] = metric_selection_framework('ReferenceTable', ref_table, 'ImpairedTable', impaired_table, 'Metrics', metrics, 'Effects', effects)
For a complete description of the available parameters and the output see the next paragraph.
The method signature is [ref_table, impaired_table, metric_scores, partialcorrs, factor_analysis] = metric_selection_framework(Name, Value)
Inputs (name-value pairs):
Effects: effects for the confound compensation.ReferenceTable: table holding features and effects of the healthy population. IfImpairedTableis specified this parameter is required.ImpairedTable: table holding features and effects of the impaired population. IfReferenceTableis specified this parameter is required.Metrics: list of metrics to evaluate. Required when using custom data (previous two parameters).NumFactors: number of factors for the factor analysis. Obtained with Scree plot (next parameter).ShowScreePlot: boolean flag to show scree plot for the number of factors.NumSimSubj: number of subjects in the simulated data.NumSimMetrics: number of metrics in the simulated data.SavePlots: boolean flag to save the plot figures in theoutput_plotsdirectory.
Outputs:
ref_tableandimpaired_table: tables with the original and compensated metrics.metric_scores: results of the per-metric analysis.partialcorrs: partial correlations between metrics.factor_analysis: result of the factor analysis.
The tool outputs the results both on the MATLAB standard output or by displaying figures. In the following, we go through a run of the framework using the default simulated data. You can advance to the next step by clicking with the mouse on displayed figures.
Here, the confounds are modeled and compensated. Further, the data is normalized using the data from the healthy population as reference. Then, the steps 1 and 2 of the metric selection and validation are executed. This is done once for each feature, and for each of them the confound correction result and ROC curve are displayed. In the MATLAB standard output, the other criteria described in the paper are shown.


The partial inter-correlations of the features are displayed in an heatmap.

At this stage, factor analysis is performed. To select the appropriate number of factors k, one has to look at the scree plot and pick kaccording to a criteria (e.g. the elbow criteria). k can be modified with the input parameter NumFactors, and the scree plot can be displayed at this stage by setting ShowScreePlot to true. The results of the factor analysis are printed to the MATLAB standard output.
Finally, a plot for sub-population analysis is displayed if your data includes a disease_severity column (see Figure 4 in the paper for more information).
