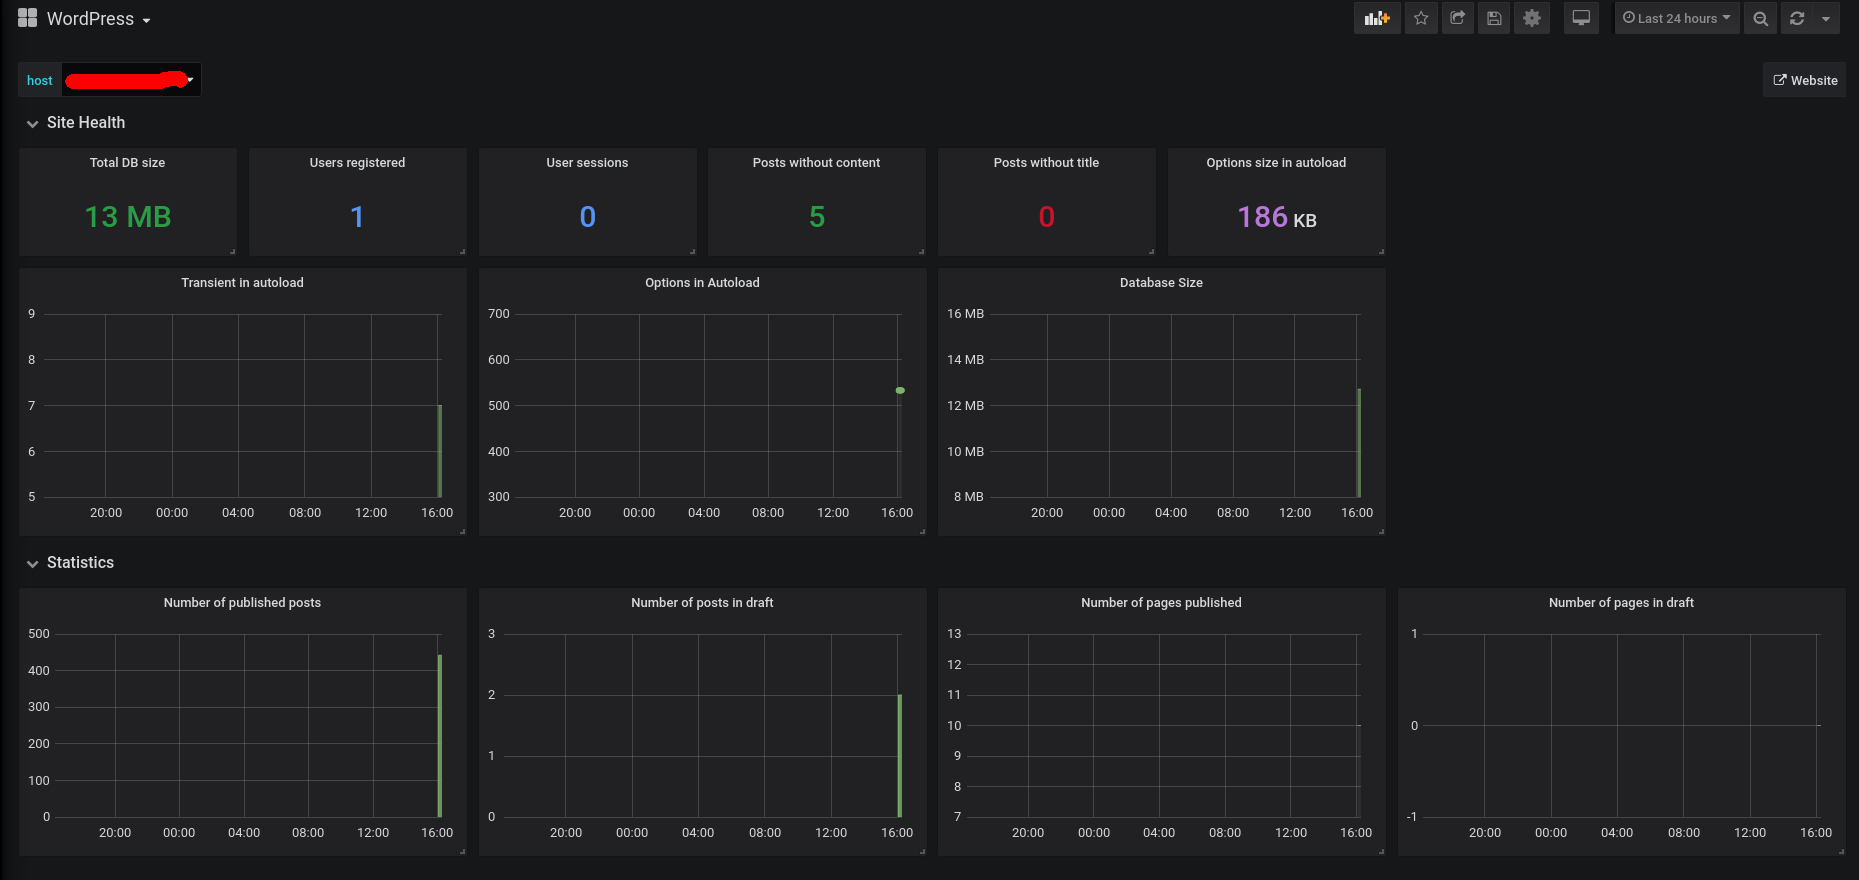
A WordPress plugin, based on https://github.com/CodeAtCode/WPDB-Status.
Grafana dashboard avalaible on official website, the wp_info data JSON for Grafana it's
available here.
- You need Composer
- Run
composer update -o
The plugin has a settings panel where you can configure what you need include the key.
To add a new target:
  - job_name: "WordPress metrics"
    static_configs:
      - targets: ["domain.tld"]
    scrape_interval: "5m"
    metrics_path: "/wp-json/metrics"
    params:
      prometheus: ['fg98dfgkj']
      users: ['yes']
      posts: ['yes']
      pages: ['yes']
      autoload: ['yes']
      transient: ['yes']
      user_sessions: ['yes']
      posts_without_content: ['yes']
      posts_without_title: ['yes']
      db_size: ['yes']
      pending_updates: ['yes']
    scheme: "https"
This plugin includes a hook to append new metrics: prometheus_custom_metrics
all=yes enables all of the default filters at once
See the included page at Tools -> Site Health -> Prometheus with specific metric parameters.
- Metrics
- Added / Improved metrics for more technical insights (DB, PHP, WordPress)
- Site Health Check
- Added section with InfluxDB Task example
- Some cleanup
- Use Prometheus Client PHP lib to make sure, the format is correct (https://github.com/promphp/prometheus_client_php)
- Removed "legacy" metrics
- Fixed warnings
- Seperated host and schema (and port)
- Added metric for writing temporary file into uploads folder
- Disabled legacy metrics by default (to avoid warnings in the logs)
- Enable it, by adding
define('PROMETHEUS_INCLUDE_LEGACY_METRICS', true);towp-config.php
- Enable it, by adding
- Major rewrite, which may break your current metrics!
- Requires at least WordPress 5.6 and PHP 7.3
- Added PHP 8.0 polyfill
- Use 'gauge' instead of 'counter'
- Define
PROMETHEUS_LEGACY_TYPEwith true to change this
- Define
- Added more metrics
- You can add custom metrics by implementing WP_Prometheus_Metrics\Metric
- Added timestamps to metrics
- Metrics will be cached for 1h by default (use filter
prometheus-metrics-for-wp/timeoutto change this) - Seperated metrics for different post types
- Site health check integration
- View url for endpoint
- Ability to generate authentication keys
Legacy support
To use 'counter' instead of 'gauge', add the following to your wp-config.php
define('PROMETHEUS_LEGACY_TYPE', true);