Credit Exploratory Data Analysis Case Study - March - 2022
Credit Exploratory Data Analysis Case Study - March - 2022 Submitted By: Sourabh S Hubballi Dated: 28/03/2022
Objective's are mentioned Below: 1.0 Problem Statement - I Introduction: This assignment aims to give you an idea of applying EDA in a real business scenario. In this assignment, apart from applying the techniques that you have learnt in the EDA module, you will also develop a basic understanding of risk analytics in banking and financial services and understand how data is used to minimise the risk of losing money while lending to customers. Business Understanding: The loan providing companies find it hard to give loans to the people due to their insufficient or non-existent credithistory. Because of that, some consumers use it as their advantage by becoming a defaulter. Suppose you work for a consumer finance company which specialises in lending various types of loans to urban customers. You have to use EDA to analyse the patterns present in the data. This will ensure that the applicants capable of repaying the loan are not rejected. When the company receives a loan application, the company has to decide for loan approval based on the applicant’s profile.Two types of risks are associated with the bank’s decision: If the applicant is likely to repay the loan, then not approving the loan results in a loss of business to the company If the applicant is not likely to repay the loan, i.e. he/she is likely to default, then approving the loan may lead toa financial loss for the company. The data given below contains the information about the loan application at the time of applying for the loan. It contains two types of scenarios: The client with payment difficulties: he/she had late payment more than X days on at least one of the first Y stalments of the loan in our sample, All other cases: All other cases when the payment is paid on time. When a client applies for a loan, there are four types of decisions that could be taken by the client/company):1. Approved: The Company has approved loan Application. Cancelled: The client cancelled the application sometime during approval. Either the client changed her/his mind about the loan or in some cases due to a higher risk of the client he received worse pricing which he did not want. Refused: The company had rejected the loan (because the client does not meet their requirements etc.). Unused offer: Loan has been cancelled by the client but on different stages of the process. In this case study, you will use EDA to understand how consumer attributes and loan attributes influence the tendency of default.

Business Objectives: This case study aims to identify patterns which indicate if a client has difficulty paying their installments which may be used for taking actions such as denying the loan, reducing the amount of loan, lending (to risky applicants) at a higher interest rate, etc.This will ensure that the consumers capable of repaying the loan are not rejected. Identification of such applicants using EDA is the aim of this case study.
In other words, the company wants to understand the driving factors (or driver variables) behind loan default, i.e. the variables which are strong indicators of default.The company can utilise this knowledge for its portfolio and risk assessment. To develop your understanding of the domain, you are advised to independently research a little about risk analytics - understanding the types of variables and their significance should be enough).
Data Understanding: This dataset has 3 files as explained below:
'application_data.csv' contains all the information of the client at the time of application.The data is about whether a client has payment difficulties. 'previous_application.csv' contains information about the client’s previous loan data. It contains the data whether the previous application had been Approved, Cancelled, Refused or Unused offer. columns_description.csv' is data dictionary which describes the meaning of the variables. 2.0 Problem Statement - II: Results Expected by Learners: Present the overall approach of the analysis in a presentation. Mention the problem statement and the analysis approach briefly. Identify the missing data and use appropriate method to deal with it. (Remove columns/or replace it with an appropriate value) Hint: Note that in EDA, since it is not necessary to replace the missing value, but if you have to replace the missing value, what should be the approach. Clearly mention the approach.

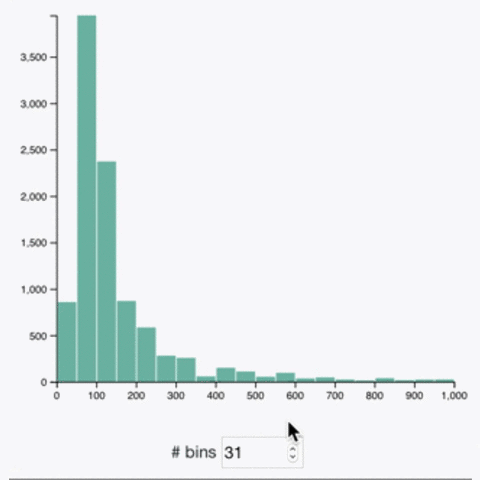
Identify if there are outliers in the dataset. Also, mention why do you think it is an outlier. Again, remember that for this exercise, it is not necessary to remove any data points. Identify if there is data imbalance in the data. Find the ratio of data imbalance. Hint: How will you analyse the data in case of data imbalance? You can plot more than one type of plot to analyse the different aspects due to data imbalance. For example, you can choose your own scale for the graphs, i.e. one can plot in terms of percentage or absolute value. Do this analysis for the ‘Target variable’ in the dataset ( clients with payment difficulties and all other cases). Use a mix of univariate and bivariate analysis etc.
Hint: Since there are a lot of columns, you can run your analysis in loops for the appropriate columns and find the insights.
Explain the results of univariate, segmented univariate, bivariate analysis, etc. in business terms. Find the top 10 correlation for the Client with payment difficulties and all other cases (Target variable). Note that you have to find the top correlation by segmenting the data frame w.r.t to the target variable and then find the top correlation for each of the segmented data and find if any insight is there. Say, there are 5+1(target) variables in a dataset: Var1, Var2, Var3, Var4, Var5, Target. And if you have to find top 3 correlation, it can be: Var1 & Var2, Var2 & Var3, Var1 & Var3. Target variable will not feature in this correlation as it is a categorical variable and not a continuous variable which is increasing or decreasing. Include visualisations and summarise the most important results in the presentation. You are free to choose the graphs which explain the numerical/categorical variables. Insights should explain why the variable is important for differentiating the clients with payment difficulties with all other cases.