The following repository contains the final project part of Saturdays.AI (https://www.saturdays.ai/) build with other three alumni.
The contributors of this project are:
Happyforce (www.myhappyforce.com) is a Employee Engagement platform used by companies to measure the level of engagement of their employees, allowing managers and teams to improve, motivate and retain talent.
Unlike a climate survey (which is usually annual), Happyforce carries out a continuous measurements of different employee engagement dimensions (https://en.wikipedia.org/wiki/Employee_engagement) via pulse surveys and a daily check-in question.

This provides and amazing dataset for research correlation and predictions based on previous gathered data.
Inside all dimensions measured by Happyforce, there is one that is a perfect match for the values that we must chase on a Saturday.ai project: a social aspect.

This dimension is Employee Stress.
Stress has been described as the health epidemic of the 21th century.

Being the workplace as one of the biggest source of stress:

With this project we will try to determine which variables mainly affect to employee's stress, and we will try to build a model for predicting when an employee will suffer stress on the following months.
The dataset is composed by two files, and can be found in the /data directory on this repository.
This first file, scores.csv, contains all the answers to the different questions of the different dimensions measured by Happyforce (more info about the dimensions here: https://myhappyforce.com/en/measure/). The number of votes recorded is 103.330, the number of participants (employees) is 6419, while the number of companies on the file is 72. On this file, we can find what it will become our target variable: stress.
Also, a second file is provided: hi.csv. This file contains the votes to the daily question "How are you today?" of the employees that have participated on any of the scores.csv. file. This file contains the 847.935 entries.
PD: A first cleanup, shows that there are duplicates on each file, due the export procedure performed by Happyforce. The numbers exposed above are after droping the duplicates.
The Happyforce stress question is formulated on a scale between 1 and 10, where 1 is high stressed and 10 is low stressed.
Knowing that, the first decision we took is to define what is an stressed employee. Based on the answers to the question:
"On a scale from 1 to 10, how would you rate the work-related stress?"
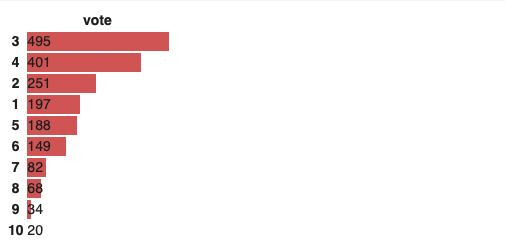
We divided the scale in three as:
- 1-3 stressed
- 4-10 not stressed.
By setting the threshold below 3 (included), a 50.3% of the employees have expressed at some point that they felt stressed, which gives us a balanced dataset.
Any DS project starts with data exploration, in order to find patterns and prepare the data for ML tasks.
This has been the most extensive phase of the project and one of the most critical as analyzing the data in one way or another can dramatically change the strategy for applying the models to our data.
The first phase, was to check the structure of the two provided files.

In the scores dataset each record represents an employee's answer to a given question. For each record we found enough variables to identify the company, the sector to which the company belongs, the id of the question, the id of the factor to which the question is associated and the date on which the question is answered, in addition to the score answer of the employee (from 1 to 10).
The hi dataset contains the answers to the Happyness Index. Each record represents one vote of an employee on a given date. The values of the HI range from 1 to 4, with 4 being the most positive rating.
Both datasets are date based, and our objective was to be able to give a prediction on if a employee will suffer stress.
For that to happen we needed to build a new dataset where we have all the information related to all other variables prior to the date where an employee answer to the stress question.
That means (as an example):
- If an employee voted x on the stress question on May... how was his/her Happiness Index the last 3 months?
- If an employee voted x on the stress question on May... what she/he voted on any other pulse question the last 6 months?
So, we crunched the data by building a function for generate that new dataset. As result we got a Dataframe with:
For each employee, that vote to the stress question on X:
- For each question on the scores file, what she/he voted 2, 3 and 6 months before.
- For each factor on the scores file, her/his average 2, 3 and 6 months before.
- For the HI on the hi file , her/his average HI 2, 3 and 6 months before.
The feature names are builded with this rules:
"vote_ " + id_question + 'q' + 'MX' + 'Y' for the questions.
"vote_ " + id_factor + 'f' + 'MX' + 'Y' for the factors.
where X is the number of months that we consider before the stress question and Y is the months that we use to work out the mean. If we want to use only the month 6 before the stress question we will use X=6 and Y=1. If we want to use all 6 months before the stress question we will use X=6 and Y=99 (we parametrised the whole period with a 99).
Due to the missing values, we finally used the whole period option (Y=99), because we have more data to make a prediction.
Also we added the Industry and the month when the stress question was answered to that new dataset.
Finally,in order to proper work, we factorized the dataframe for prepare it for the different models, and removed our target variable. Also we removed the factor that includes that question.
One first review of the categorized data shows quite interesting results:

By sectors, the NATURAL_RESOURCES is the one where employees express higher levels of stress. However the number of employees is low compared with FINANCIAL_SERVICES_INSURANCE, where is also high and the number of participants is bigger.
In any case, in most sectors the 40% of the employees show high levels of stress. Surprisingly :-), COMPUTER_SOFTWARE_IT_SERVICES is the last on that range, with a 42% of employees showing some level of stress.
One last lesson: if you want a quite life, move to MANAGEMENT_CONSULTING.
A first check of the correlation...
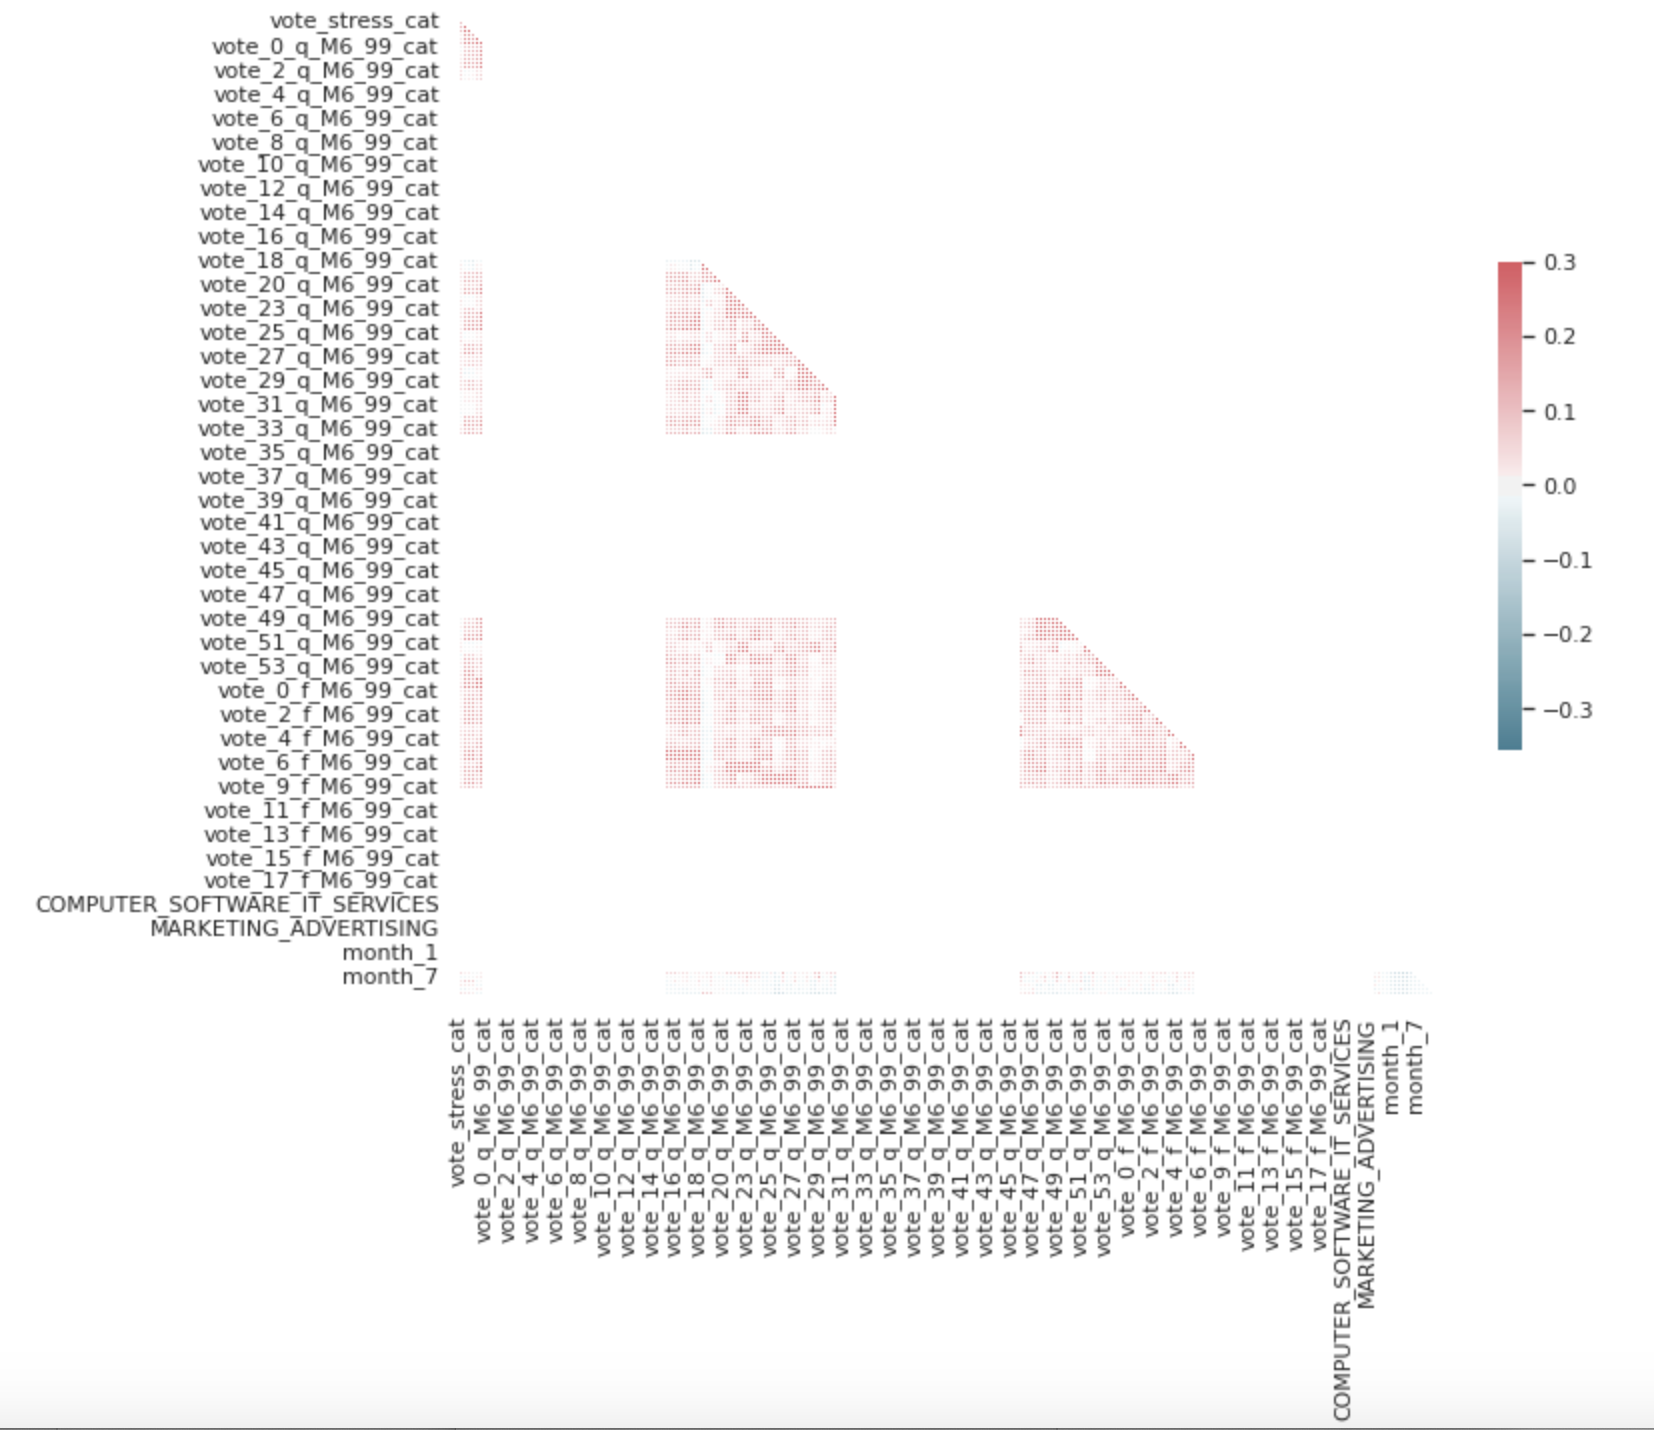
... and filtering by any variable where the correlation is between the -6% and the 6% shows that:
-
The Happiness Index question (in any of the different time-frames) has the biggest correlation over stress.
-
Also the following questions have also a higher correlation:
- The business goals and strategies set by senior leadership are taking |COMPANY_NAME| in the right direction.
- |COMPANY_NAME| communicates in a clear and effective way us.
- I trust that the people I work with are committed to do a good job
- On a scale from 0-10, how would you rate the benefits |COMPANY_NAME| offers?
- On a scale from 1 to 10, how likely are you to recommend |COMPANY_NAME| as good place to work?
- I would rate the processes for determining pay in |COMPANY_NAME| as:
- I would rate the amount of resources, people and efforts that |COMPANY_NAME| invests to achieve its goals as:
- My teammates, welcome opinions different from their own.
- Do you have the tools and resources you need to do your job?
-
Employees working on FINANCIAL_SERVICES_INSURANCE seems to reflect more stress than others. On the other hand, MANAGMENT_CONSULTING and COMPUTER_SOFTWARE_IT_SERVICES have a negative correlation which shows that they suffer less stress.
Note: Do you remember the image above? go and check it again:
- Salary & Benefits is the cause number one of stress.
- Lack of alignment (goals, trust in coworkers, inclusion...)
- Tools & Resources...
Do you see a relation between the causes of stress and the answers on the dataset? ;-)
With the data ready for the game, we decided to focus on supervised algorithms:
- Decision tree.
- Random forest.
- Logistic Regression.
Although is the simplest model, it's enough powerful in most of the cases.
In order to find the best combination of hyper-parameters, we performed a Grid Search over Scikit DesicionTreeClassifier
to tune the deep ('max_depth') and the number of features ('max_features') finding that with:
- max_depth=2
- max_features=19
we achieve a accuracy of 0.5782

With the objective of looking for better results we gave it a try to the Random Forest model; We performed the same approach: a Grid Search, giving as result that the best hyper-parameters are:
- max_depth=110
- n_estimators=130
- min_samples_leaf=2
- min_samples_split=40
- max_leaf_nodes=35
we achieve a accuracy of 0.5889
One of the advantages of the Random Forest is that we can obtain which features are more relevant in the prediction of the objective variable In our case, we found:

We decided to check what happens if we build a Random Forest only with those variable, without getting better results.
Our final try was try to predict using a Logistic Regression.
The first approach was to build a Logistic Regressor classifier using only the best features detected on the Random Forest model. Obviously, there are a lot of features and the p-vales are too big.
We found out a feature combination where the p-values are smaller than 0.05. The result of the model is:

The resulting model has a precision of 0.615.
On this model, beside the HI of 3 moths before, and those industries:
- COMPUTER_SOFTWARE_IT_SERVICES
- FINANCIAL_SERVICES_INSURANCE
- NATURAL_RESOURCES
was quite interesting to see that the following questions:

have an higher impact on the prediction. By revisiting again the initial image of which factors or conditions affect to work related stress, we identify some of them.
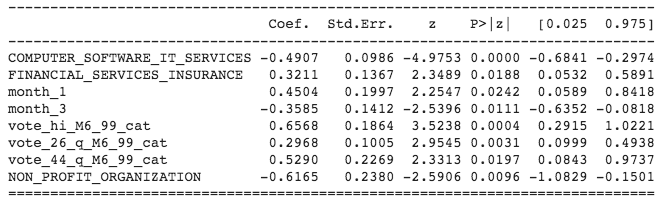
Empowered by those results, and due previous results, we built a second model, using those variables:
- COMPUTER_SOFTWARE_IT_SERVICES
- FINANCIAL_SERVICES_INSURANCE
- month_1
- month_3
- vote_hi_M6_99_cat
- vote_26_q_M6_99_cat
- vote_44_q_M6_99_cat
- NON_PROFIT_ORGANIZATION
The result was a little bit higher than the previous model 0.622
Comparing the confusion matrix of the first iteration vs the second one:
- First: array([[138, 55], [ 90, 94]])
- Second: array([[130, 63], [ 83, 101]])
We can see that our first model predicts a little bit better.
To conclude our model analysis, we studied how important are each feature in our models.
For the model 1

we can see the most important feature are if the employee works in a NATURAL_RESOURCES company (33%). The second feature is the question "I trust that the people I work with are committed to do a good job" (20%) and the thirth one is the 3 months happiness index (11%).
It's important to note that more than 40% of the prediction depends on the company industry and a 6% depends on the month when you are. The other half of the prediction is influenced by the team confidence, the manager lead, the resourses and the mastery (apart from happiness index).
For the model 2

we can see the most important feature are if the employee works in a NON_PROFIT_ORGANIZATION company (20%). The second feature is the 6 month happiness index (18%) and the thirth one is the question "The business goals and strategies set by senior leadership are taking |COMPANY_NAME| in the right direction." (17%).
In that case, the model have a 35% of dependences on the company industry, 40% on the questions and more than 20% of the prediction depends on the month of the stress question.
We can see how in January there are more stress and in March less than the other months (look at the coefficients). In addition, the model coefficients reflects correcly the behaviour observed in the EDA and in the correlation analysis, where we saw that computer_software_it_services and non_profit_organization are the sectors with less percentage of stress (behind the mean).
Under the app directory, you will find a Streamlit demp app that calculates the probability of suffer stress on the next month.
The app uses the persisted generated model of the Random Forest Classifier that you can find on the notebook
Traditionally the results of any employee surveys, purse surveys are left just the table of HR or managers. No outcomes but action plans that are not always fulfilled or have an impact on employees.
But...
What if we were able to give value to employees automatically to all the contributions they make in surveys or pulses? Or if we were able to tell a particular employee what will "hurt" him or her in the future, and how to act before it happens?
The practical implications of this project are much broader than stress. In the employee's day-to-day life, and throughout our professional career we live hundreds of situations and feelings that we have to face, and skills (soft skills) to develop or improve.
One of the best outcomes of this project may be the inclusion of these models in Happyforce, thus supporting its mission of helping employees and organizations to be better, and impacting directly on employees life.

Random forest
https://towardsdatascience.com/understanding-random-forest-58381e0602d2 https://towardsdatascience.com/decision-tree-and-random-forest-explained-8d20ddabc9dd https://www.analyticsvidhya.com/blog/2016/04/tree-based-algorithms-complete-tutorial-scratch-in-python/#nine