Home

Reynald Alolor · Jan Andrew Camero · Jairus Roben Catacutan · John Edwin Ibe
Redentor Periabras · Clint Lennard Santos · Shekiera Ann Soria
Abstract
This project describes an approach of speech analysis by implementing the Mel-Scale Frequency Cepstral Coefficients (MFCC) given a speech signal of spoken words as an input. The tool will be designed to observe the collective use of different disciplines under Signal Processing such as Windowing, Frameshift, FFT, and DCT.
In signal processing, the mel-frequency cepstrum (MFC) is a representation of the short-term power spectrum of a sound. This feature extraction method that was first mentioned by Bridle and Brown in 1974 is based on experiments of the human misconception of words.
The ideal objective of implementing MFCC is to extract a feature vector containing all information about the linguistic message, in this case, the MFCC is expected to mimic some parts of the human speech production and speech perception. Moreover, the MFCC mimics the logarithmic perception of loudness and pitch of human auditory system and tries to eliminate speaker dependent characteristics by excluding the fundamental frequency and their harmonics.
1.) Type in SpeechAnalysis(x) in Matlab, having "x" as the desired length of record in seconds.
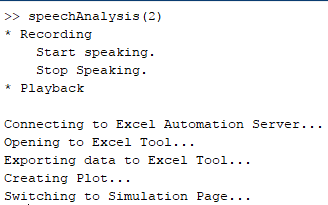
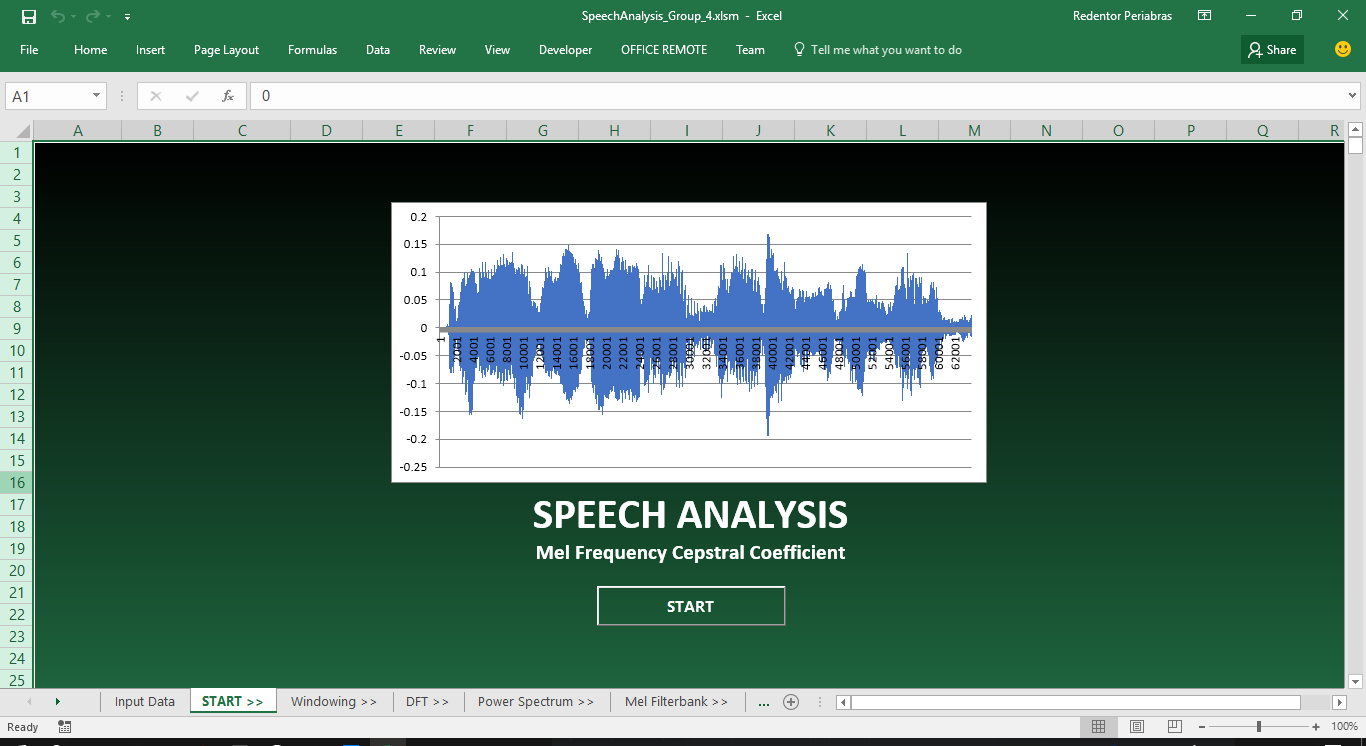
2.) Once the recording is done, wait for the Excel file to be initialized. The tool is ready once the "START" button appears.
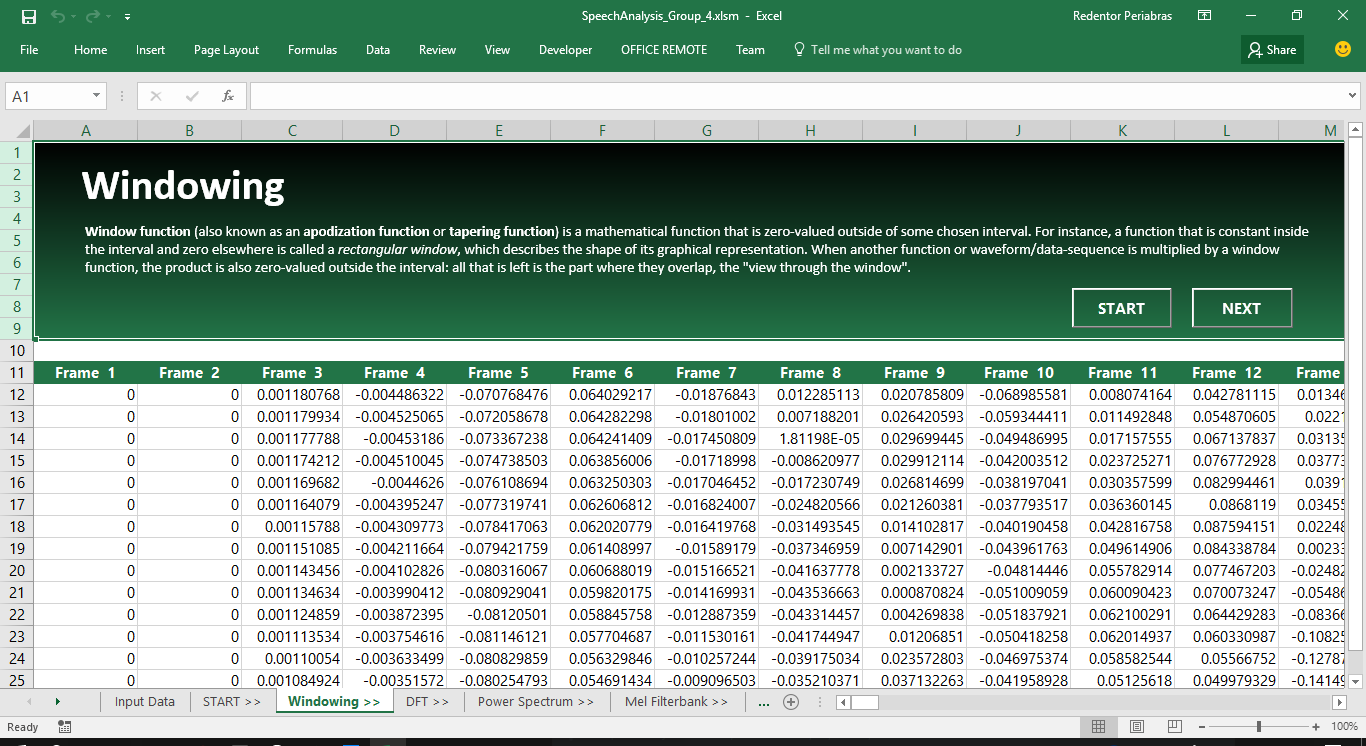
3.) In the "Windowing" sheet, two buttons are present:
- START button will simulate the Windowing function, in which it will frame the signal into 25ms frames.
- NEXT button will direct the simulation to "Fourier Transform" sheet.
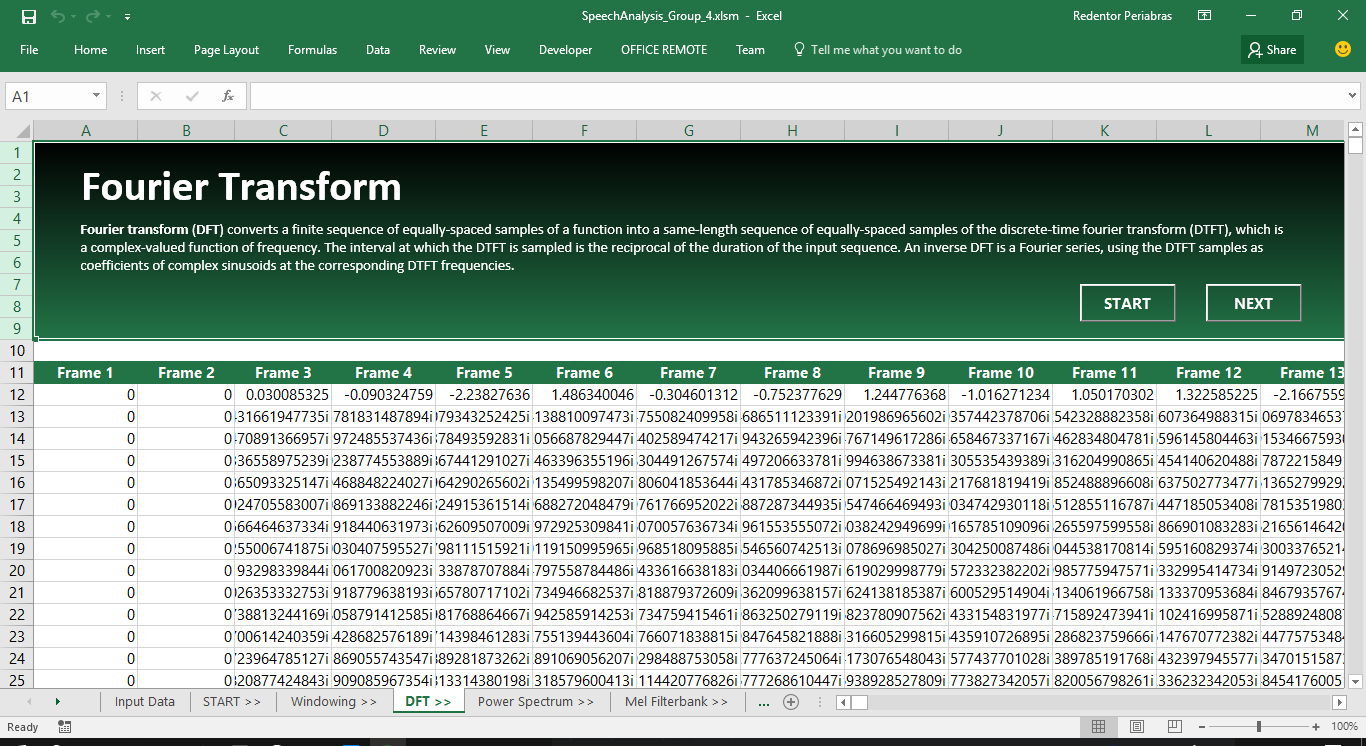
4.) "Fourier Transform" sheet will calculate the Discrete Fourier Transform (DFT) of the signal per frame:
- START button will perform Fast Fourier Transform for each frame. Complex values will be generated once done.
- NEXT button will direct the simulation to "Power Spectrum" sheet.
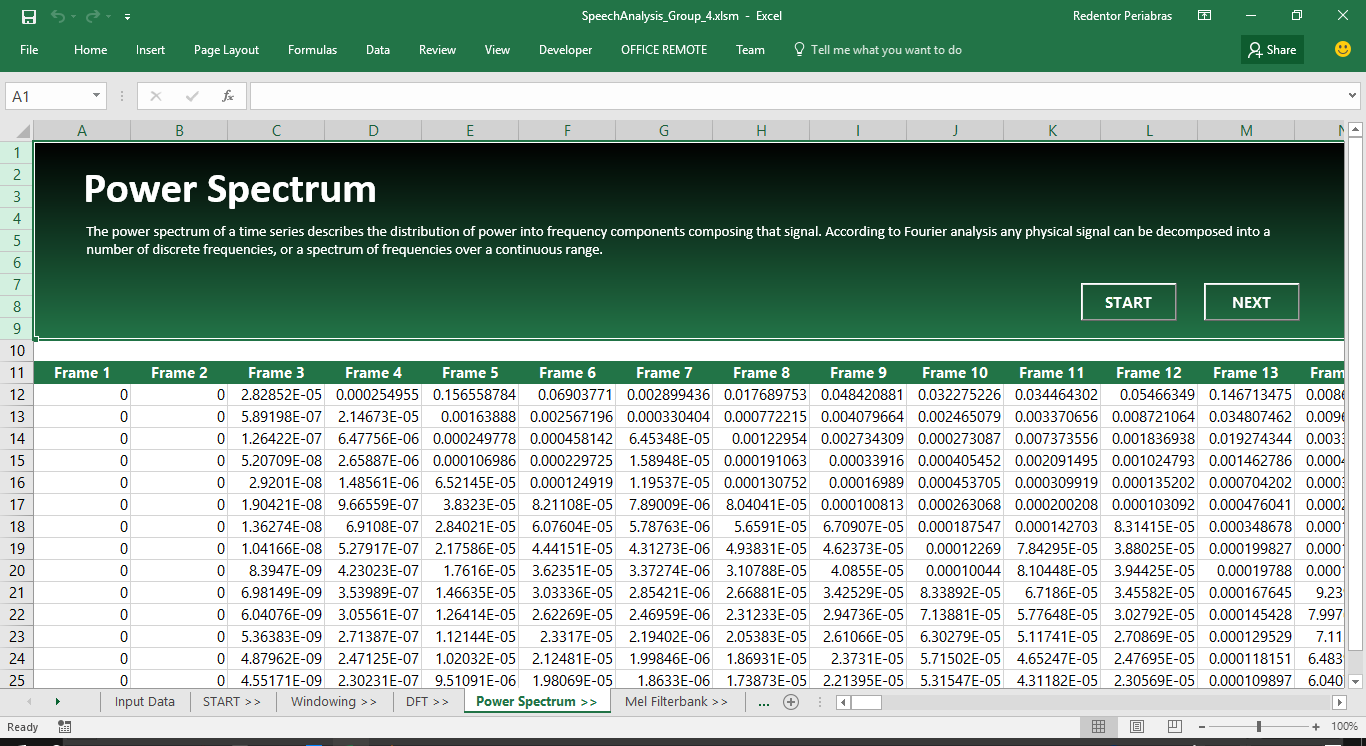
5.) At this point, the "Power Spectrum" sheet will be displaying the Periodogram estimate per DFT.
- START button will calculate the Periodogram of each DFT in each cell by using the amplitude spectrum of the DFT.
- NEXT button will direct the simulation to "Mel Filterbank" sheet.
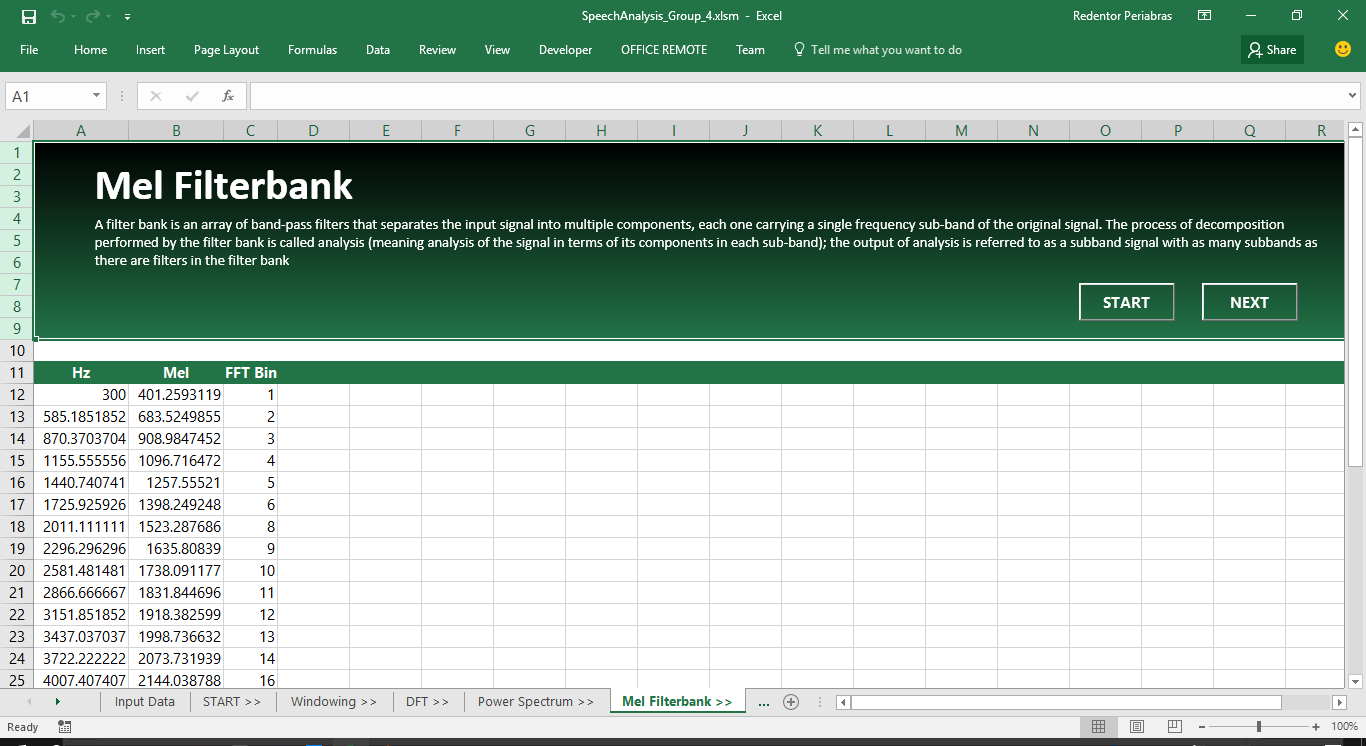
6.) In the "Mel Filterbank" sheet, there will be three (3) set of values that will be generated:
- START button will display the three (3) Filterbanks.
- "Hz" column contains the Filterbank frequencies measured in Hertz
- "Mel" column contains the Filterbank frequencies converted into Mel
- "FFT Bin" column contains Filterbank frequencies that are rounded to the nearest FFT bin.
- NEXT button will direct the simulation to "Filterbank Energy" sheet.
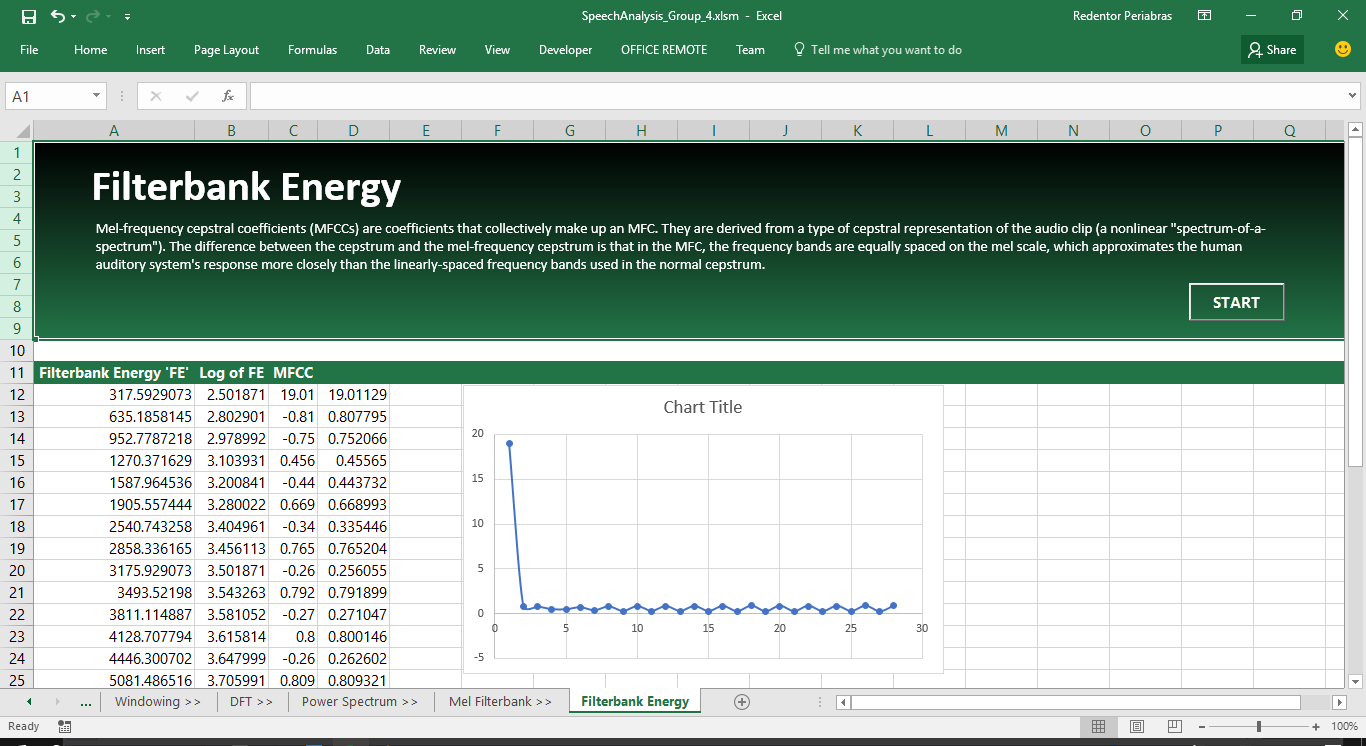
7.) For the last sheet, the "Filterbank Energy" sheet will display the generated 26 MFCC.
- START button will display the transformation of the Filterbank Energy from raw form to Mel-Frequency Cepstral Coefficient.
- "Filterbank Energy 'FE'" column contains the Filterbank Energy in raw form.
- "Log of FE" column contains the Logarithm of every Energy.
- "MFCC" column contains the Discrete Cosine Transform of the Logarithm of the raw Energy, which represents the 26 MFCC result.