Cannot decode traces payload, read limit reached #818
Comments
|
Yeah, looks like an issue on the trace agent end; we'll want to figure out what factors on the Ruby end might be contributing to this. Can you share a little more context about what kinds of traces your Ruby application is sending?
If I had to make a very rough first guess, it might have something to do with payload size when transmitting traces to the agent. Although it's premature to assert this is the cause or prescribe solutions, it might be possible to play with a few levers to see if they have any effect. On the Ruby side we could play with the buffer size to make flushes smaller, or if your network setup permits it, utilize UDS to transmit traces more frequently. I won't say either of these are likely to be silver bullets though, as it appears the restriction might be largely driven by the agent. Might be a good idea to see if there are any configurations that can be utilized there, although I'm not familiar enough to recommend any. Any debug information you can provide about what payloads your tracer is submitting to the agent will help us develop a more accurate assessment, and a quicker resolution. |
|
Yeah, so it's a very large batch job. Jobs can take many, many hours. We're looking to do tracing to see where our best bang for our buck would be in regards to improving performance. While our traces themselves may be very large, we also don't expect to have nearly as many as a web service would expect to have. Span count is up in the millions. It appears to be consistent. |
|
Gotcha, although the agent can handle such large numbers of spans, it's not handled well when they're all in one trace; on the Ruby side, we typically only flush spans to the agent after the trace completes. There is a buffer limit which will prevent memory usage from overflowing, but it will drop any spans that overflow this limit. It's very possible that its filling the buffer entirely, then the payload sent to the agent is too large for it to handle in a single HTTP request. We do have a feature called partial flushing that might alleviate this, however, it's seldom been used and is largely still experimental. If you're interested, you can try it by configuring the tracer: Datadog.configure do |c|
c.tracer partial_flush_timeout: 3, min_spans_before_partial_flush: 1000, max_spans_before_partial_flush: 10_000
endIf you play with those settings, you might find a balance that helps. In any case, please do let us know if this helps at all. |
|
Hmm ok so good news and bad news...The good news is I can see all the data being passed over the wire on a long job and I can see most of the data in the analytics view (though a decent chunk appears to be missing). However, the trace seems totally messed up when I use the partial flush. It's showing the entire trace as one random span over a few ms. Opposed to the same job being ran without the partial flush options which has 4k spans for a short job. I'm assuming somethings getting mangled somewhere =/ |
|
Okay gotcha, bummer on the partial flush. Is there a screenshot you can share for that? Would be helpful if we try to fix this feature. Will consult the team to see if there's a better way to handling long running jobs, or if there's a way to stream spans up for unfinished traces. |
|
Same problem here, I was trying to find my worker traces in Datadog and found nothing. This is what I found in my Sidekiq logs: |
|
I think I have the same problem. I am also using sidekiq. |
|
Thank you for all the reports @SpyMachine, @allaud, @usamaSaddiq! v0.35.0 has been released, which adds dynamic payload chunking for large flush operations perform by Our preliminary investigation tells us that most, if not all, If this error persists in your application after this new release, it is likely because a single trace is being generated that is too large to be flushed, in that case I recommend trying to enable Partial Flushing (c.tracer.partial_flush.enabled = true) in your application. In any case, let us know of any further errors that still occur from now on. |
|
Just a friendly ping to see if anyone in this GH issue is still seeing issue with payload read limit reached with newer versions of the tracer. |
|
@marcotc I'm seeing the issue with version |
|
@marcotc Not sure if this helps, but I just noticed that this error started to happen more frequently once we increased the size of our EC2 instances in AWS. Before that change, it only happened a couple of times (we didn't even notice) but after the change is happening pretty constantly. |
|
Hi, sorry for late reply, just got around to looking at this again. It appears to be working much better for me now! |
|
@SpyMachine what Tracer Version are you using now? I'm using 1.19.1 and still have this issue |
|
@SpyMachine I'm glad you saw improvements! @tegon @gc-dev1 I think that at this point, we should follow up with each one of you individually, having the full context of your environments. @gc-dev1 I noticed you are seeing a similar issue with .NET. If you already have a support ticket open for that issue, I'd suggest investigating that one first, as the underlying cause might be the same (maybe it's the agent). That might save you an extra support thread with us. |
|
Hey @marcotc Sorry for the late reply. I've encountered this issue again when I'll open a support ticket with DD as suggested in the above comment. |
|
Hey 👋 . I'm going to go ahead and close this issue for now. As Marco said, we're very interested in knowing if you still are seeing issues, please get in contact and do let us know! |
|
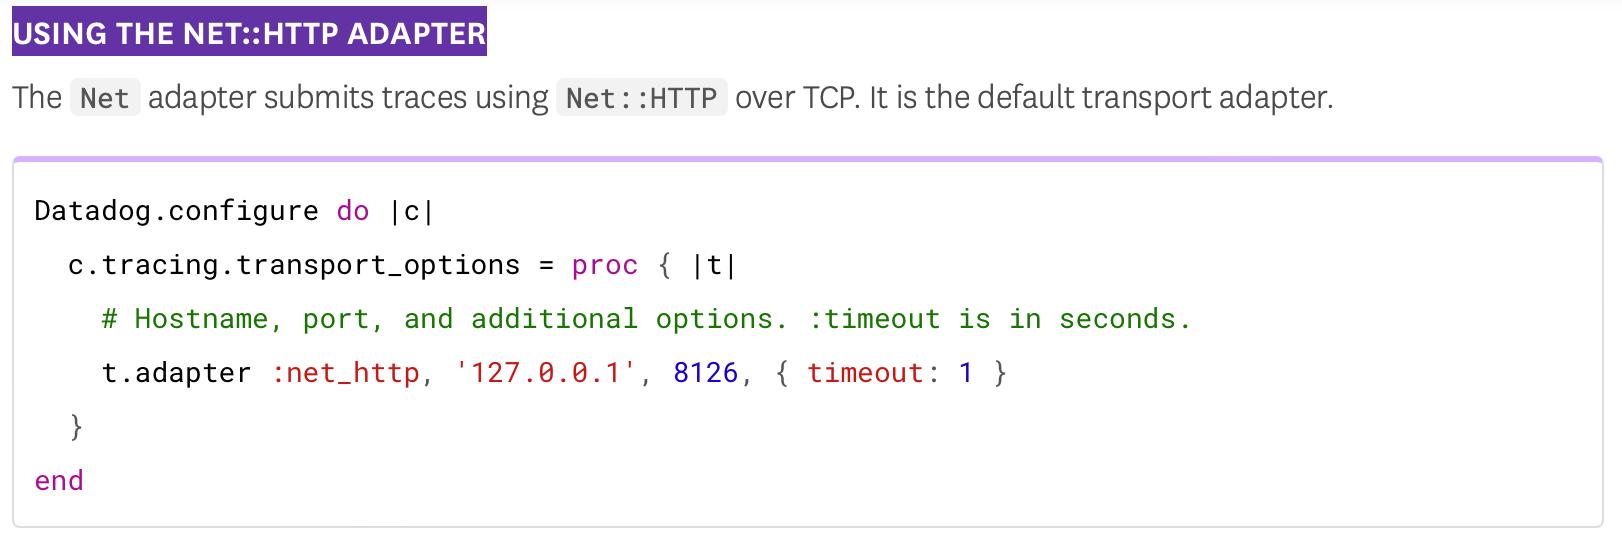
This may not be the same issue, but we saw And in If you're using This was the source of our problem and after adjusting that to @ivoanjo is a timeout of Screenshot of the docs for historical purposes if it changes:
|
As raised in #818, the default `timeout` example is rather far away
from the actual default being used, which may lead customers that
copy-paste the example to have a bad experience.

I also discovered we had an incorrect constant with the default
timeout which was not even being used anywhere (you can grep for it
 to confirm!).

Thanks @benjaminwood for the awesome suggestion!
|
Good point! Opened #2205 to improve on this, definitely having an example which nowadays we would not recommend to customers is not a good idea. |
|
Awesome, thank you @ivoanjo! I'm sure this will prevent a few headaches for customers down the road. |
I am receiving the follow error in my trace agent logs.
2019-09-17 19:34:45 UTC | TRACE | ERROR | (pkg/trace/api/api.go:372 in handleTraces) | Cannot decode v0.4 traces payload: read limit reachedand my app is showing:
I know my trace logs are rather large but didn't realize this would be a problem. Is there a way to get around this?
The text was updated successfully, but these errors were encountered: