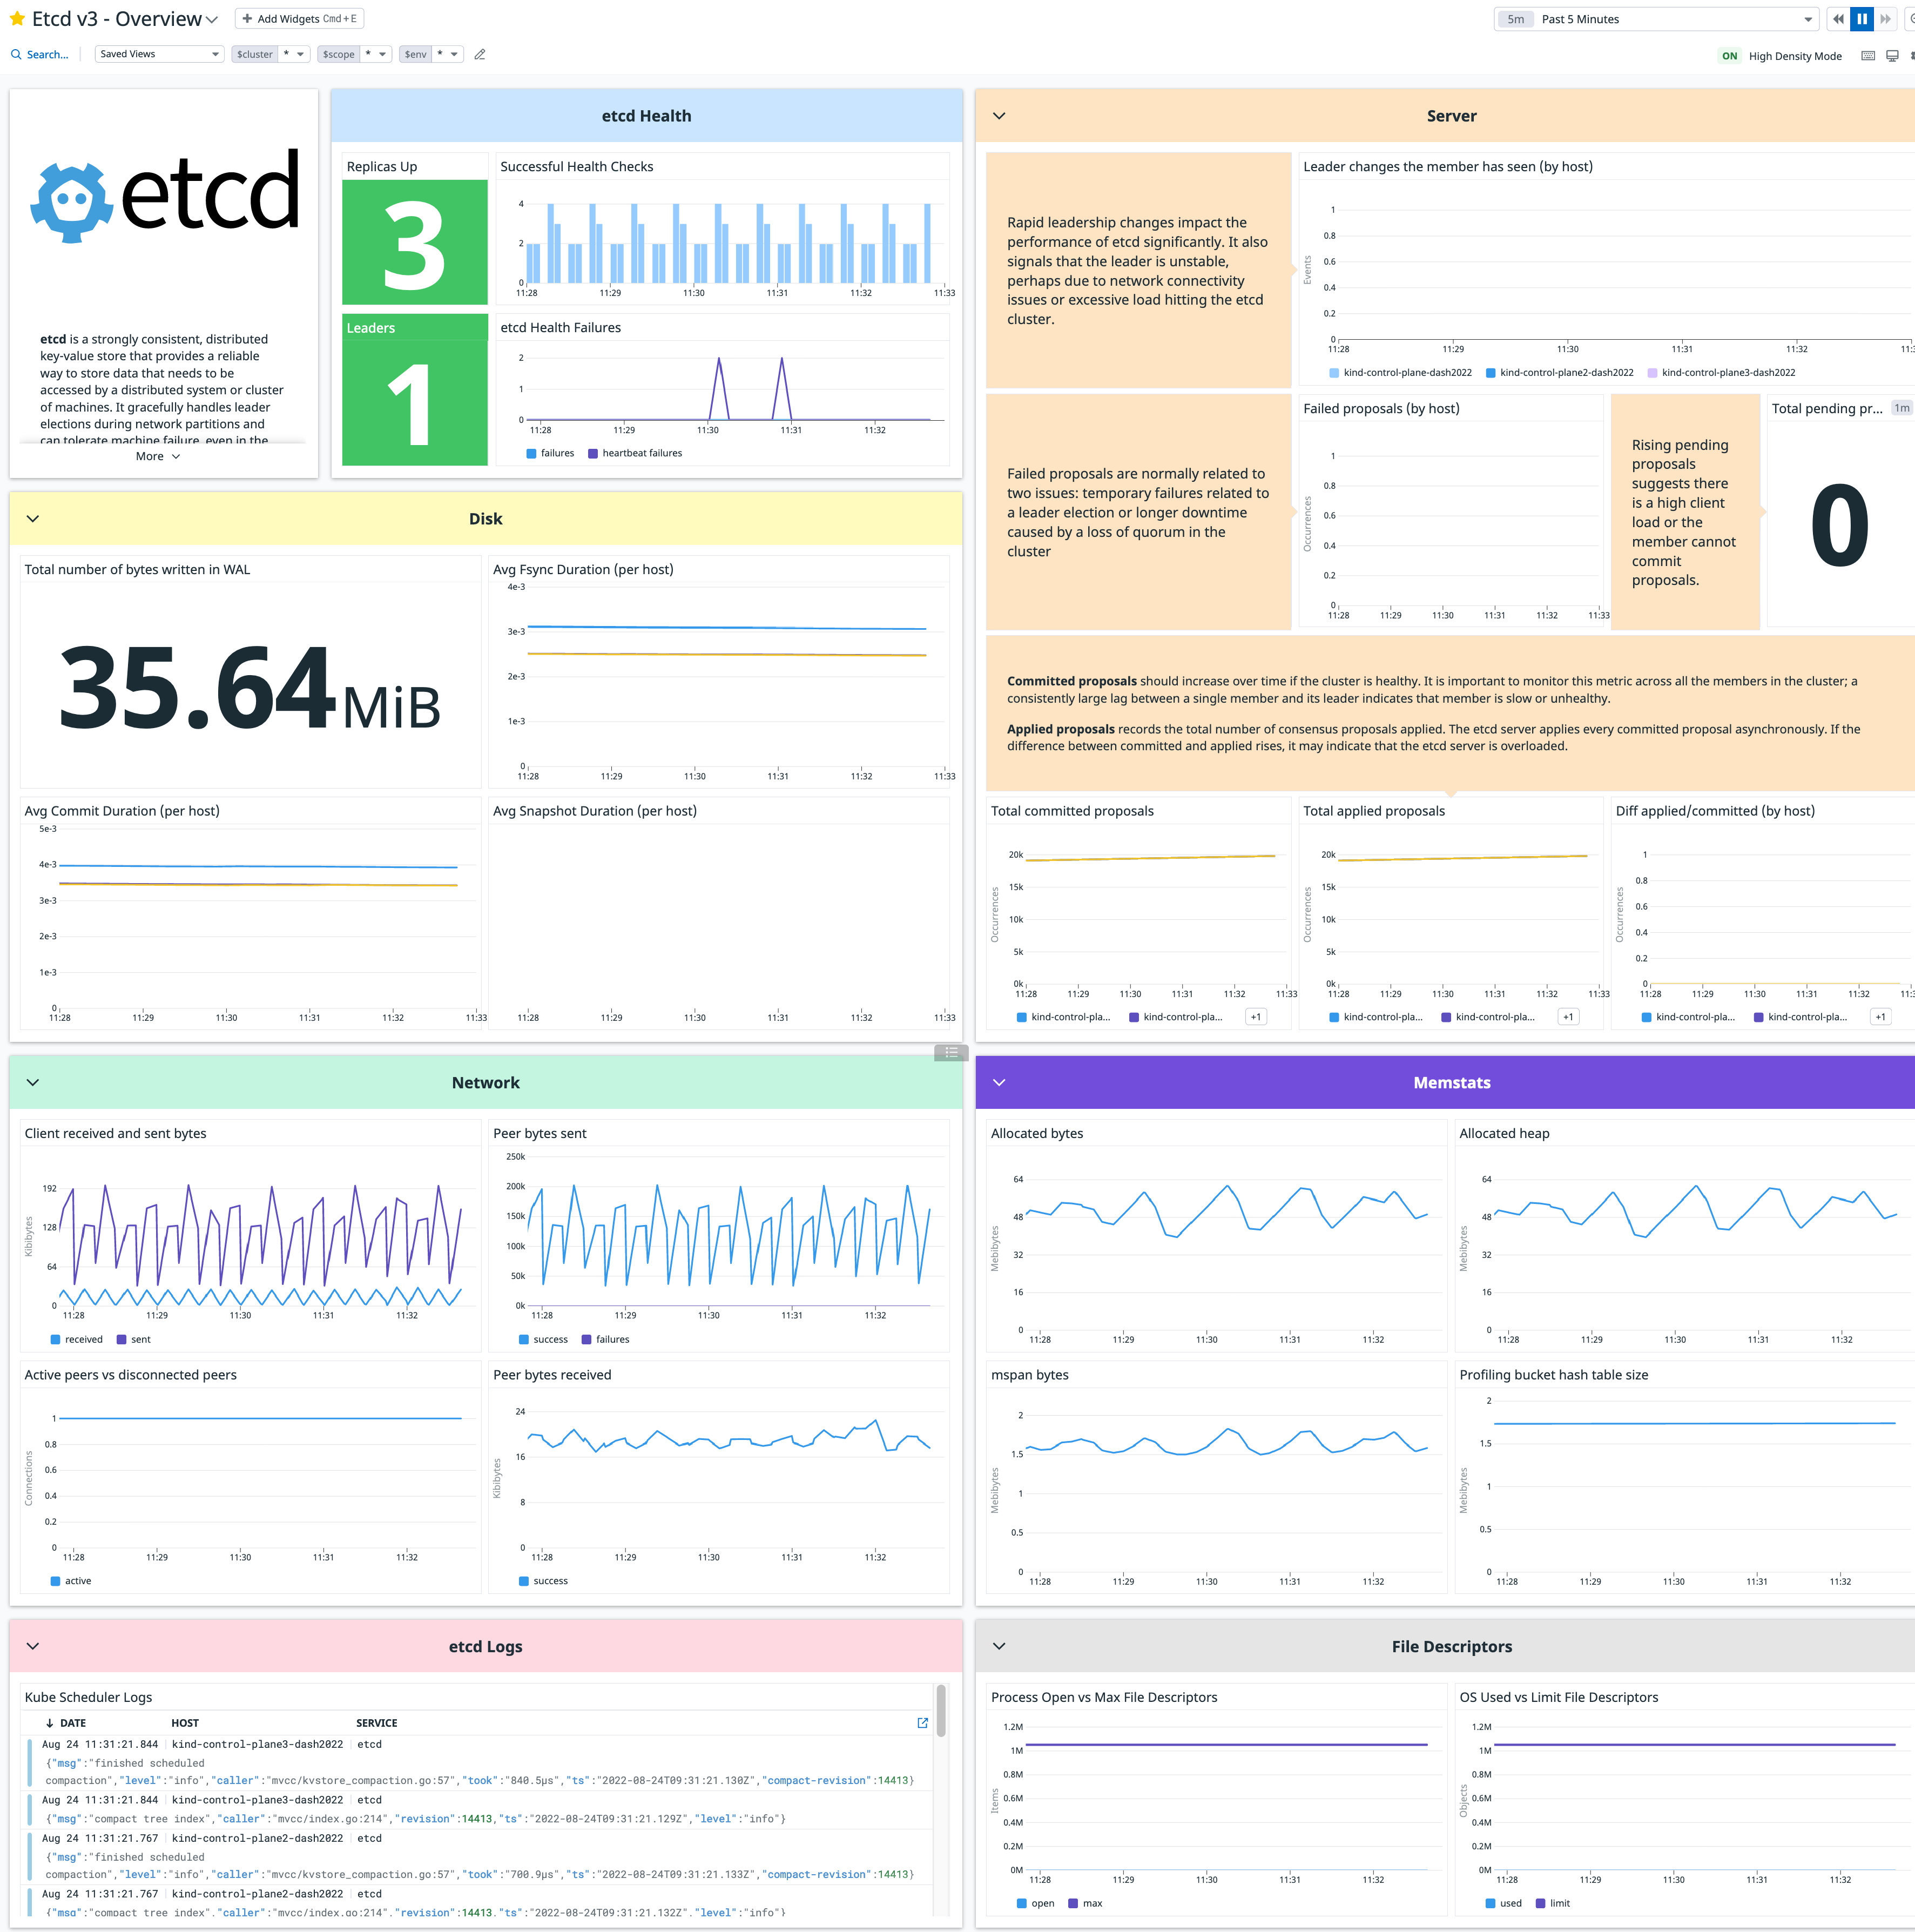
Collect Etcd metrics to:
- Monitor the health of your Etcd cluster.
- Know when host configurations may be out of sync.
- Correlate the performance of Etcd with the rest of your applications.
The Etcd check is included in the Datadog Agent package, so you don't need to install anything else on your Etcd instance(s).
To configure this check for an Agent running on a host:
- Edit the
etcd.d/conf.yamlfile, in theconf.d/folder at the root of your Agent's configuration directory to start collecting your Etcd performance data. See the sample etcd.d/conf.yaml for all available configuration options. - Restart the Agent
-
Collecting logs is disabled by default in the Datadog Agent, enable it in your
datadog.yamlfile:logs_enabled: true
-
Uncomment and edit this configuration block at the bottom of your
etcd.d/conf.yaml:logs: - type: file path: "<LOG_FILE_PATH>" source: etcd service: "<SERVICE_NAME>"
Change the
pathandserviceparameter values based on your environment. See the sample etcd.d/conf.yaml for all available configuration options.
For containerized environments, see the Autodiscovery Integration Templates for guidance on applying the parameters below.
| Parameter | Value |
|---|---|
<INTEGRATION_NAME> |
etcd |
<INIT_CONFIG> |
blank or {} |
<INSTANCE_CONFIG> |
{"prometheus_url": "http://%%host%%:2379/metrics"} |
Collecting logs is disabled by default in the Datadog Agent. To enable it, see Kubernetes log collection.
| Parameter | Value |
|---|---|
<LOG_CONFIG> |
{"source": "etcd", "service": "<SERVICE_NAME>"} |
Run the Agent's status subcommand and look for etcd under the Checks section.
See metadata.csv for a list of metrics provided by this integration.
Etcd metrics are tagged with etcd_state:leader or etcd_state:follower, depending on the node status, so you can easily aggregate metrics by status.
The Etcd check does not include any events.
See service_checks.json for a list of service checks provided by this integration.
Need help? Contact Datadog support.