Project on products that can be recommended on some purchased product.Market Basket Analysis will help you to design different store Layouts.

Nowadays Machine Learning is helping the Retail Industry in many different ways. You can imagine that from forecasting the performance of sales to identify the buyers, there are many applications of machine learning(ML) in the retail industry. “Market Basket Analysis” is one of the best applications of machine learning in the retail industry. By analyzing the past buying behavior of customers, we can find out which are the products that are bought frequently together by the customers.
When we go to any supermarket or shop online we try to purchase all the item we need together instead of buying each item seperately. Thus we can define Market Basket as a basket which is used to group together items of a person’s interest which he/she will buy in one transaction. Each trip to the market is a single transaction, and in case of e-commerce all items bought in a single login is a transaction
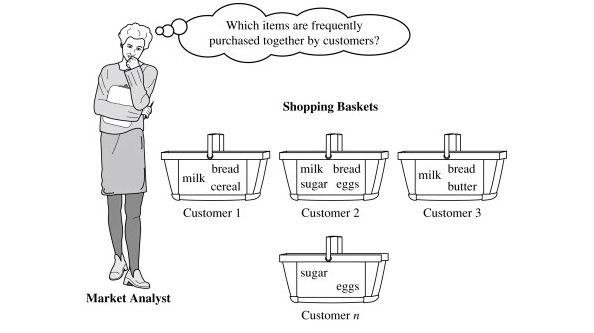
This process identifies customer buying habits by finding associations between the different items that customers place in their “shopping baskets” . The discovery of this kind of association will be helpful for retailers or marketers to develop marketing strategies by gaining insight into which items are frequently bought together by customers.
For example, if customers are buying milk, how probably are they to also buy bread (and which kind of bread) on the same trip to the supermarket? This information may lead to increase sales by helping retailers to do selective marketing and plan their ledge space.
-
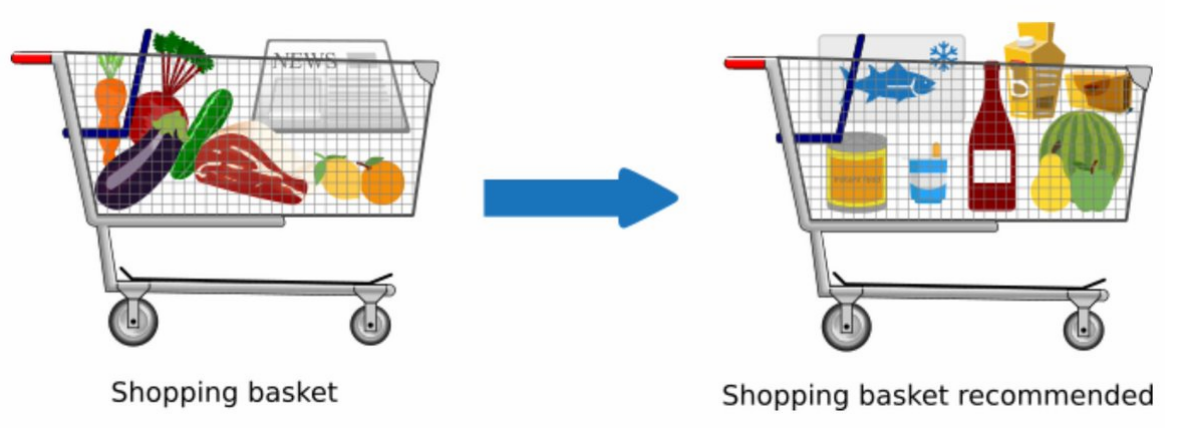
Cross Selling: It is a stratergy where the seller encourages the customer to spend more money by recommending related products that complement what is being bought already by the consumer. This stratergy would encourage the customer to spend more than he/she had actually thought he/she would.
-
Product Placement: When you go to supermarket you may see that the milk items are kept together. Moreover you may see that as you move forward you find the bread making items such as flour, butter, eggs etc kept just after the milk products. This placement of the items on the supermarket shelf follows planogram. A planogram is defined as a “diagram or model that indicates the placement of retail products on shelves in order to maximize sales”.
Association Rules are widely used to analyze retail basket or transaction data, and are intended to identify strong rules discovered in transaction data using measures of interestingness, based on the concept of strong rules.
An example of Assosciation Rules 👇👇👇👇👇👇👇👇👇👇👇👇
  Assume there are 100 customers

  10 of them bought milk, 8 bought butter and 6 bought both of them.

  bought milk => bought butter

  support = P(Milk & Butter) = 6/100 = 0.06

  confidence = support/P(Butter) = 0.06/0.08 = 0.75

  lift = confidence/P(Milk) = 0.75/0.10 = 7.5

Apriori Algorithm is a widely-used and well-known Association Rule algorithm and is a popular algorithm used in market basket analysis.It helps to find frequent itemsets in transactions and identifies association rules between these items. The limitation of the Apriori Algorithm is frequent itemset generation. It needs to scan the database many times which leads to increased time and reduce performance as it is a computationally costly step because of a huge database. It uses the concept of Confidence, Support.
  Lift (A => B) = 1 means that there is no correlation within the itemset.
  Lift (A => B) > 1 means that there is a positive correlation within the itemset, i.e., products in the itemset, A, and B, are more likely to be bought together.
  Lift (A => B) < 1 means that there is a negative correlation within the itemset, i.e., products in itemset, A, and B, are unlikely to be bought together.
There are many advantages to implementing Market Basket Analysis in marketing. Market basket Analysis(MBA) can be applied to data of customers from the point of sale (PoS) systems.
It helps retailers with:
1.Increases customer engagement
2.Boosting sales and increasing RoI
3.Improving customer experience
4.Optimize marketing strategies and campaigns
5.Help to understand customers better
6.Identifies customer behavior and pattern
Let us take an example from Amazon, the world’s largest eCommerce platform. From a customer’s perspective, Market Basket Analysis is like shopping at a supermarket. Generally, it observes all items bought by customers together in a single purchase. Then it shows the most related products together that customers will tend to buy in one purchase.
In this implementation, we have to use the Store Data dataset that is publicly available on Kaggle. This dataset contains a total of 7501 transaction records where every record consists of the list of items sold in just one transaction.
   all_items = data.melt()["value"].dropna().sort_values()
   print(f"There were {all_items.nunique()} different products:\n", all_items.unique())
The dataset contanins 120 different products.
Among them mineral water is the most purchased products

Assuming that only one unit of each item was bought in each transaction, asparagus is sold the least.


Now we apply apriori function and pass minimum support here we are passing 10%. means 10 times in total number of transaction that item was present.

We have association rules which need to put on itemset here we are setting based on lift and has minimum lift as 1.2.

According the above table we can easily say that the dependency between (herb & pepper) and (ground beef) is high since lift value is approximately 2.5x of threshold value and conviction is higher than 1.

According the redifined table there is a significant relationship between ground beef and spaghetti ,red wine,olive oli

From the above table it is easily seen the antecedents from the itemset corresponding the consequents where 'spaghetti' present.