Get Started with using LLFI with GUI
##Overview Here we describe the procedure for performing fault injections in LLFI using the GUI. We provide step-by-step instructions to inject fault and to view the results. The process differs slightly for Hardware/Software Injection and the differences are described below.
##Fault Injection Procedure using the GUI The first step is to select the target program for fault injection. The user can upload any standalone C/C++ source file by selecting; File->Open File, and any C/C++ project by selecting; File->Import Project. It is also possible to directly upload the intermediate representation (IR) file with .ll file extension.
The figure below is a screenshot for opening a single file.

The procedure contains the following steps once the file or project is uploaded:
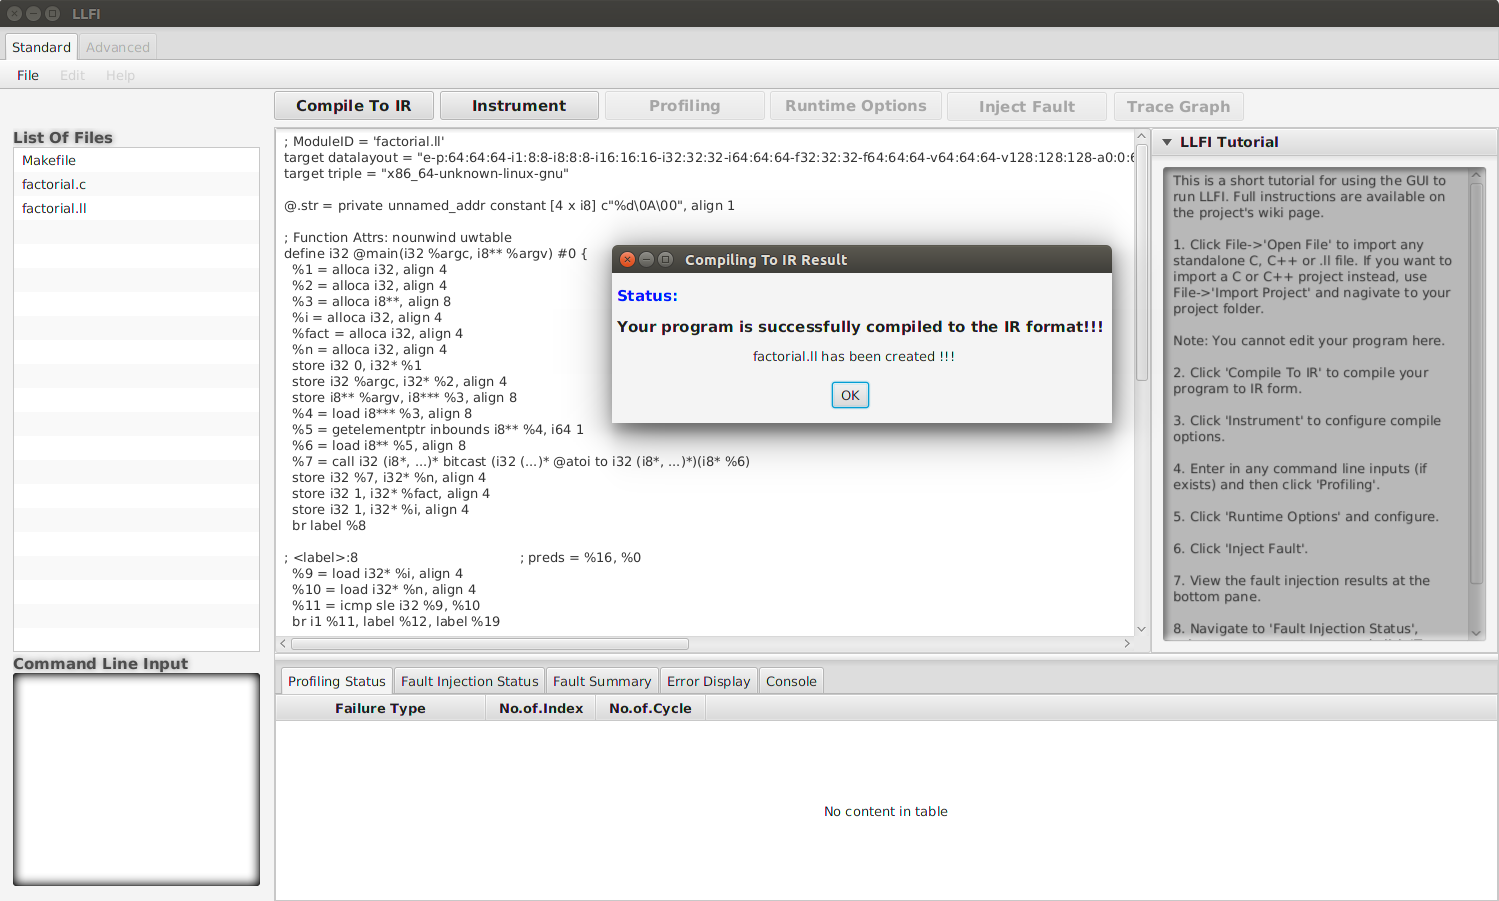
1) Compile To IR: If a C/C++ source file or project is uploaded then click on the "Compile To IR" button. When the program is successfully compiled, a success message with the name of IR file that is created will be displayed. If IR file is uploaded then this step will be skipped. The figure below is a screenshot of a successful completion of "Compile To IR".
2) Instrument: Once the intermediate representation (IR) file is created click on "Instrument" button. The instrument dialog box will open, where the user can select the configuration parameters (input.yaml). Instead of creating a new configuration, the user can also upload any .yaml file (correct format) by clicking on "Select Profile…" button.
For Hardware Faults Injection, select "Hardware Injection", then select the Instruction Type, Register Location and trace options before clicking the "Instrument" button in the dialog box. The figure below is an example of the Hardware Faults Instrument interface.

For Software Failures Injection, select "Software Injection", then select one or more failures types and trace options before clicking the "Instrument" button in the dialog box. Available software failures are scanned using Software Failure Auto Scan. If more than one software failures are selected, Batch Mode Script will be used instead. The figure below is an example of the Software Failures Instrument interface.

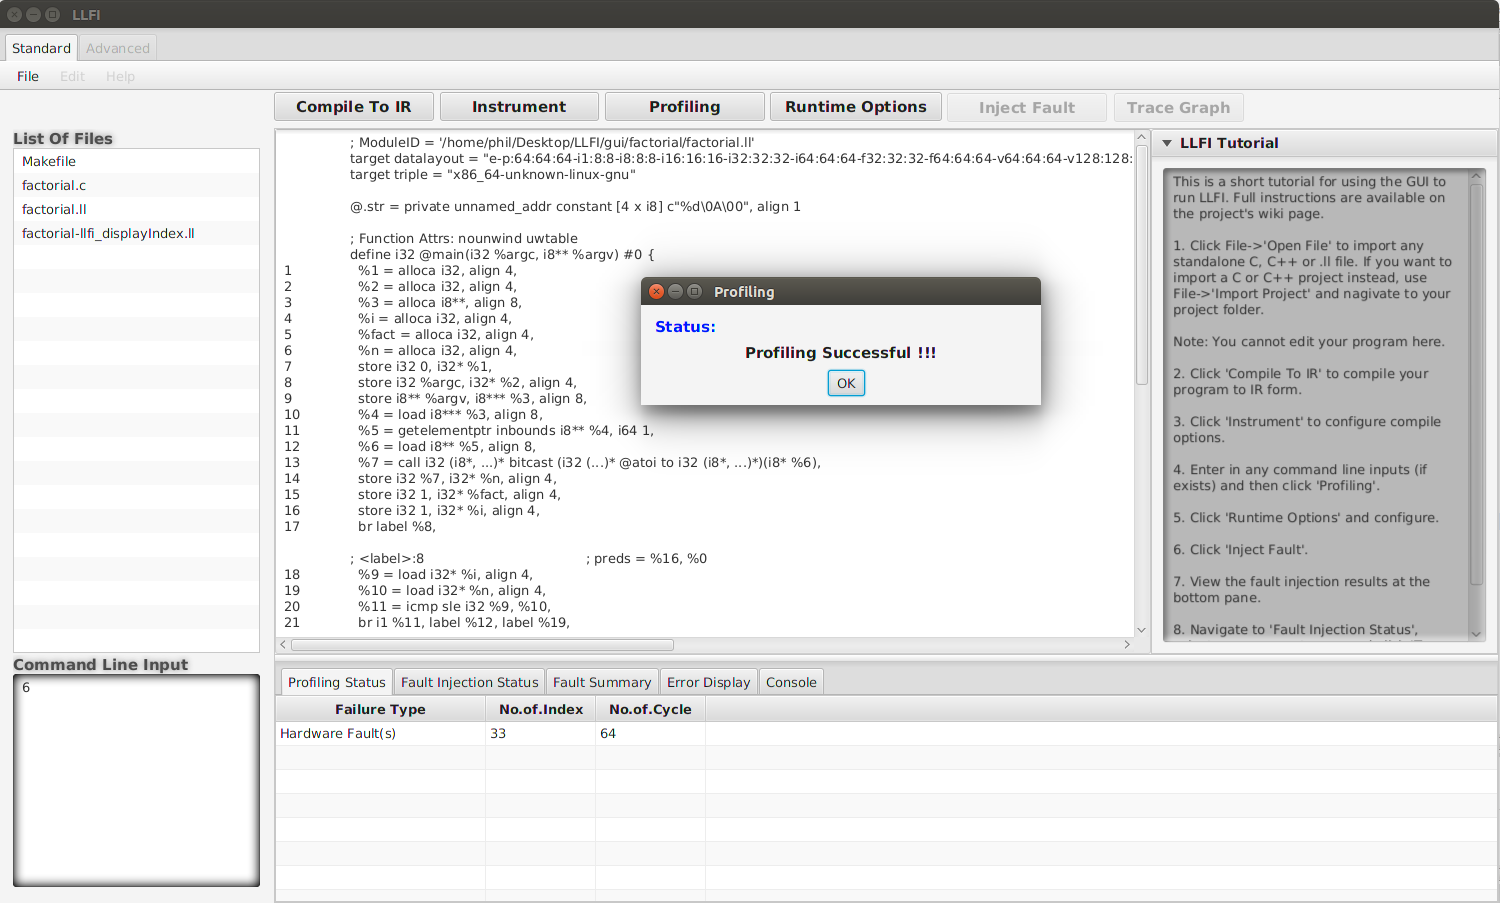
3) Profiling:After instrumentation, click on the "Profiling" button. However if the program requires any command line inputs, provide them in the "Command Line Input" text box before clicking "Profiling". Profiling displays the No.of.Index and No.of.Cycle on the Profiling Status tab in the bottom pane.
The figure below is a successful completion of hardware faults profiling.
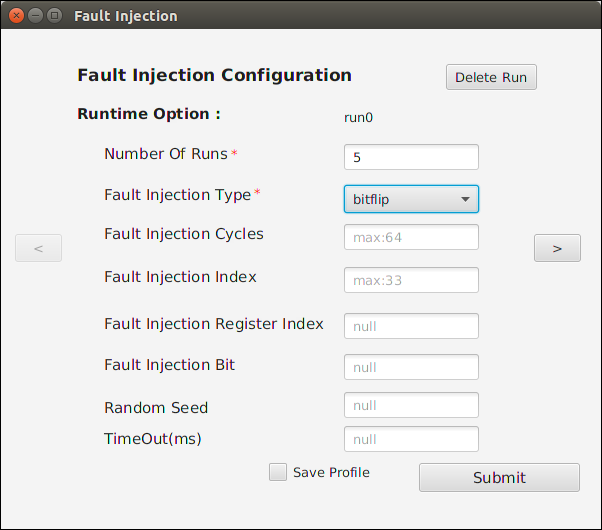
4) Runtime Options: Click on the "Runtime Options" to configure the fault injection. The user can also save the profile by checking the "Save Profile" checkbox before clicking "Submit". If the user uploaded a .yaml file with the runtime options then this step could be skipped. Click on the "Delete Run" button to delete a runtime option.
For Hardware Faults Injection, the user should provide Number of Runs and Fault injection type (mandatory), while other inputs are optional. The figure below is a screenshot of the Hardware Runtime Options interface.
For Software Failures Injection, the user should provide Number of Runs (mandatory), while other inputs are optional. If more than one Software Failures are selected in the "Instrument" step, Batch Mode Script will be used instead. LLFI does not currently support multiple software injection in a single run, so each software failures are run separately. Each Software Failure are then run "Number of Runs" times. The figure below is a screenshot of the Single Software Runtime Options interface.

5) Fault Injection: Click on the "Inject Fault" button to perform fault injection. When fault injection is completed click on the "Fault Injection Status" and "Fault Summary" tabs to view the result of the fault injections.
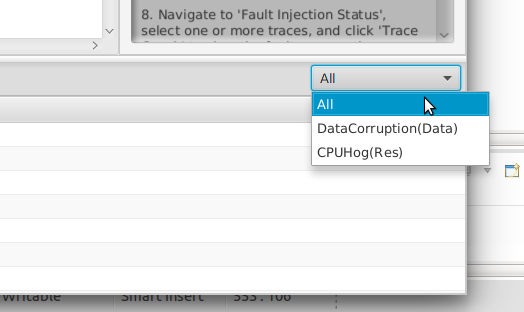
For Software Failure Injection, if you have selected multiple software failures, you can also filter the results ("Fault Injection Status" and "Fault Summary") by the type of failure in the dropdown menu at the bottom right corner of the GUI.
The figure below is a screenshot of a completion of a Hardware "Inject Fault", you can also see the "Fault Injection Status" table in the figure.

6) Trace Graph: Select one or more traces from the "Fault Injection Status" tabs. Click on the "Trace Graph" button and a trace graph window will pop up. The trace graph contains the flow of the LLVM IR instructions, and the mapping information of LLVM IR instructions to the C source code (if applicable). The tracegraph can be viewed using zgrviewer or your system's default PDF viewer. The figure below is a screenshot of a sample trace graph.

You can also view a textual summary of differences between the golden run and the fault injected run(s) by clicking the checkbox "Show Graph Output Text". This will open up the text file containing the differences in the default text viewer. This feature is especially useful for large programs where the graph may take a long time to render.
###SDC Option:
By default the SDC's are reported by making a diff between the std_outputfile and the golden_output. The user can customize the way SDC are generated by writing a script and provide the path of the script to the environment variable COMPARE.