
This example demonstrates how to display sparklines in grid cells to visualize data trends.
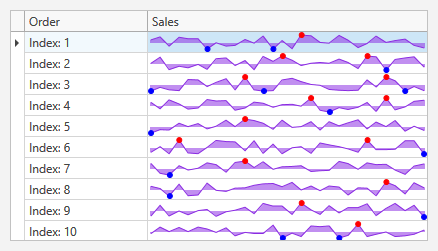
The WPF SparklineEdit control includes dozens of appearance options and ships with the following chart types: Area, Bar, Line, Win/Loss. In this example, the Grid control displays area charts (sparklines). Replace AreaSparklineStyleSettings with another style object to change the chart type. Options include:
- Bar - SparklineStyleSettings
- Line - SparklineStyleSettings
- Win/Loss - SparklineStyleSettings