This plugin plots sunburst chart with the data required passsed into it.
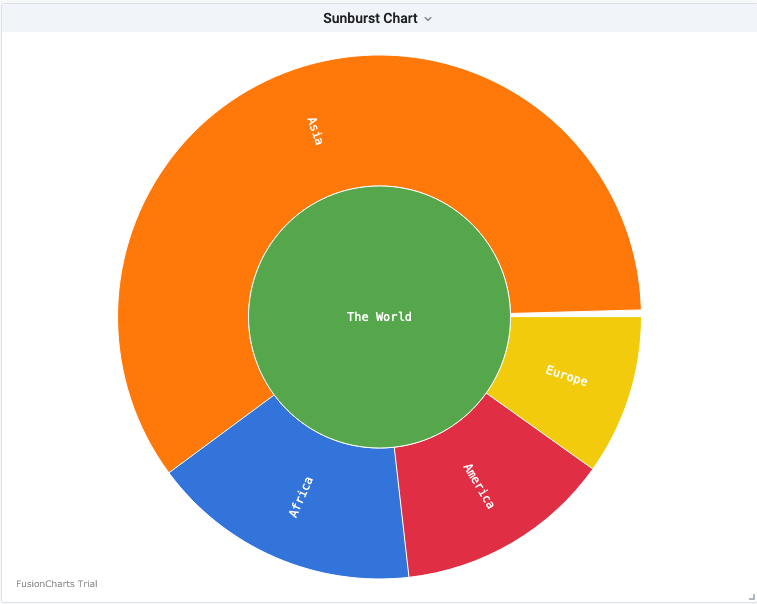
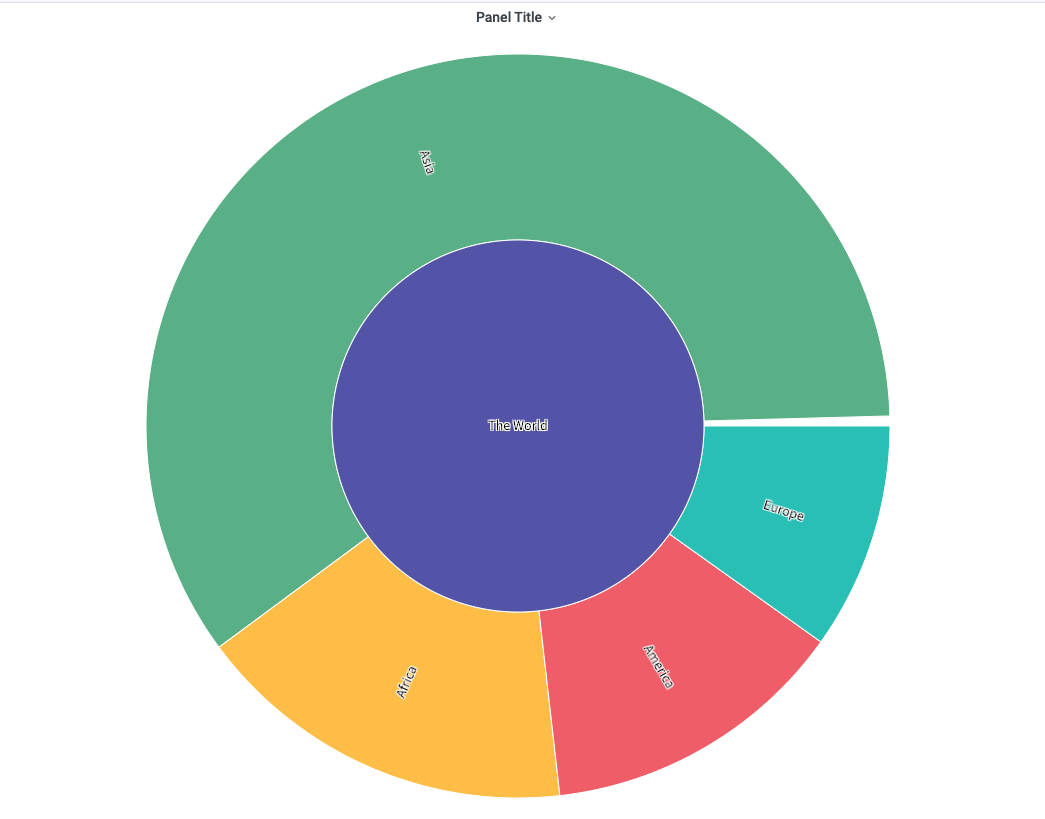
Sunburst chart is a multi-level Pie Chart, and Radial Treemap — is typically used to visualize hierarchical data structures. A Sunburst Chart consists of an inner circle surrounded by rings of deeper hierarchy levels.
Understanding on how to the structure data is of the most difficult part while plotting any kind of graphs. We will now see how to import the data into the influxdb to plot a sunburst graph. Here's a example, which we will further understand:
  {
    "id": "0.0",
    "parent": "",
    "name": "The World",
    "count": 7542011839
  },
  {
    "id": "1.3",
    "parent": "0.0",
    "name": "Asia",
    "count": 4503248822
  },
  {
    "id": "1.1",
    "parent": "0.0",
    "name": "Africa",
    "count": 1256268025
  },
  {
    "id": "1.2",
    "parent": "0.0",
    "name": "America",
    "count": 1006801064
  },
  {
    "id": "1.4",
    "parent": "0.0",
    "name": "Europe",
    "count": 743253404
  }
]
The first id, in this case i.e '0.0' be the parent or center of the graph, having some count(value) and some other parameters in form of name , parent etc.
{
  "id": "0.0",
  "parent": "",
  "name": "The World",
  "count": 7542011839
}
Note: The center or the parent won't have any parent linked to it, hence has a empty value in it
Now, lets move to its children, which are items having names with Asia, Africa, Europe, America having similar structure as the first one, but with parent = '0.0' which is ideally the id of the parent. So yes, that's the way we link the children with the parent. And you may further link the level-2 children with level-1 and go on... Here's the reference of the sunburst chart
Now, lets see how to query the data on Grafana dashboard after importing the above data into the database
So the above chart can be used using any format in-order to plot (time series or table), so just add a panel. Select the sunburst graph and add the query. Something like:
Select * from <Measurement>
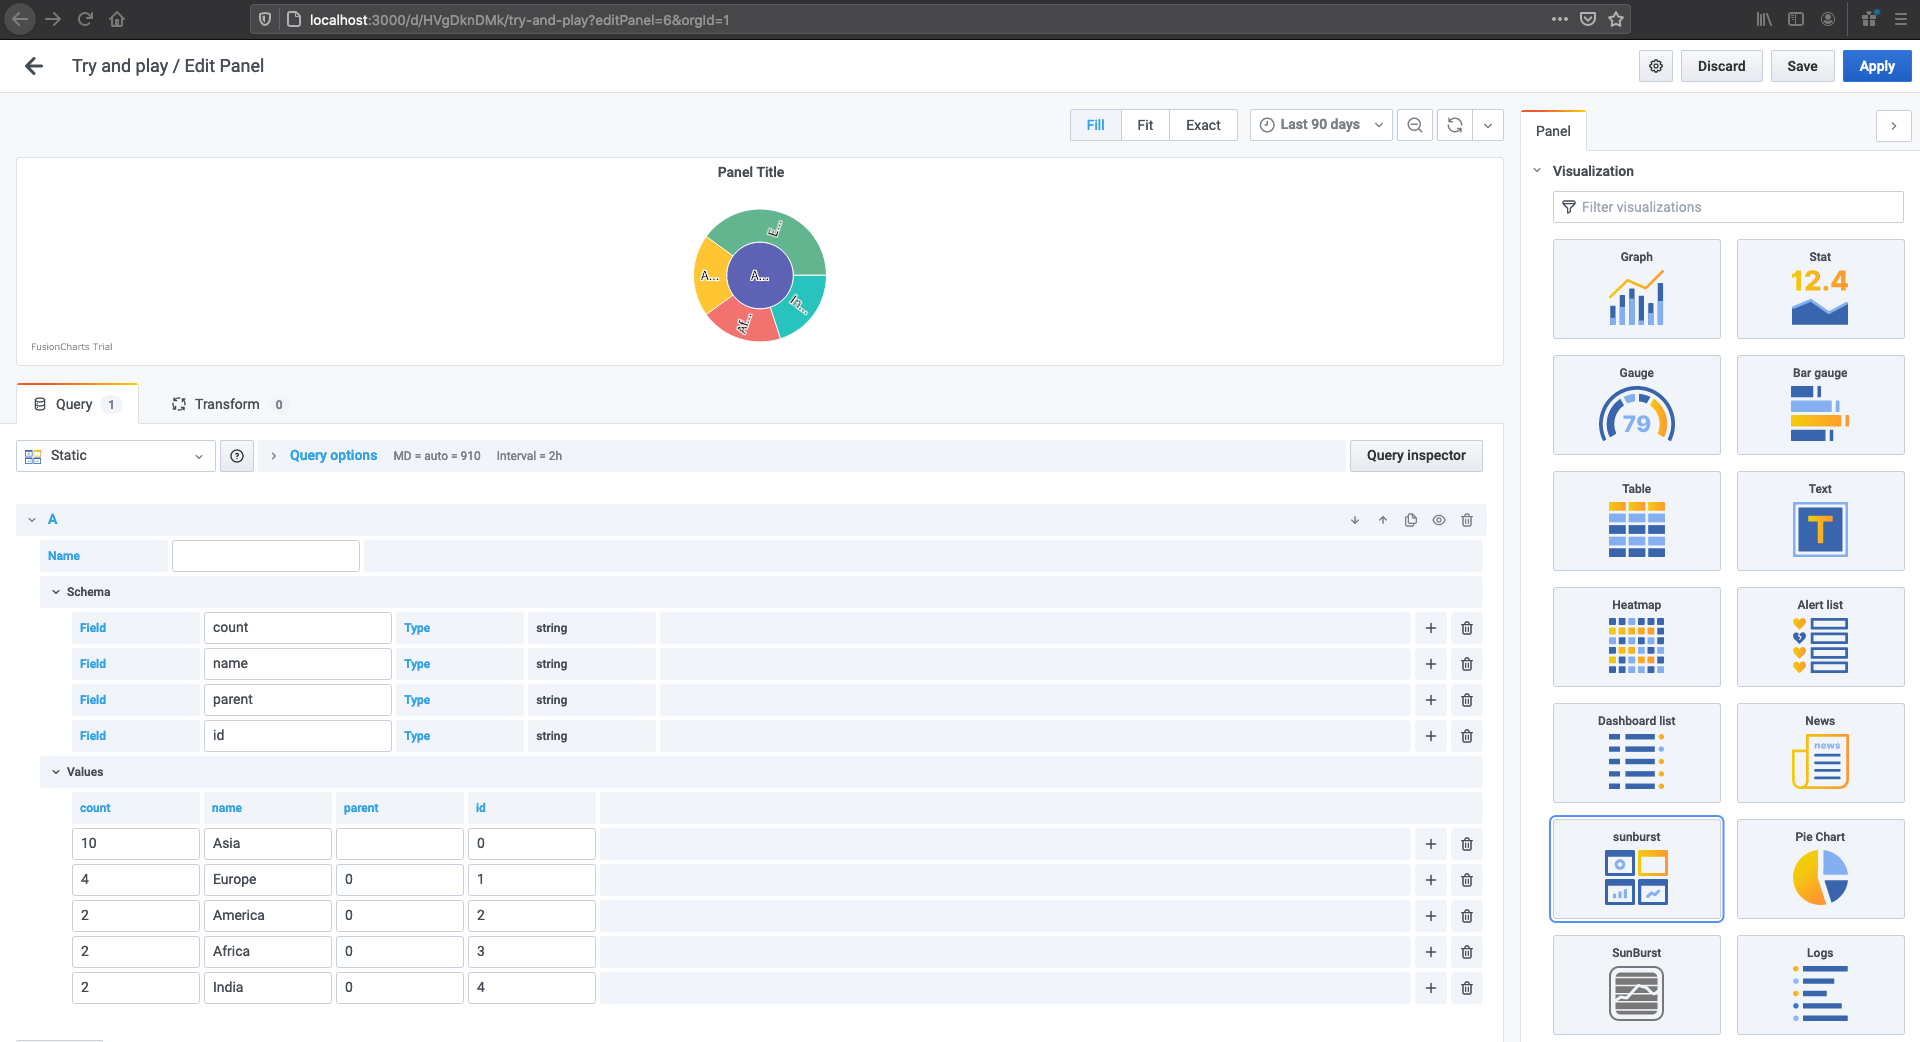
And there you go, having your data to be plotted in sunburst style. We have used fusion charts to plot the sunburst graph you may further change the style depending on the need or requirement for more reference, refer to theFusion charts.
- Install dependencies
yarn install- Build plugin in development mode or run in watch mode
yarn devor
yarn watch- Build plugin in production mode
yarn buildThanks for reading!!
- Build a panel plugin tutorial
- Grafana documentation
- Grafana Tutorials - Grafana Tutorials are step-by-step guides that help you make the most of Grafana
- Grafana UI Library - UI components to help you build interfaces using Grafana Design System