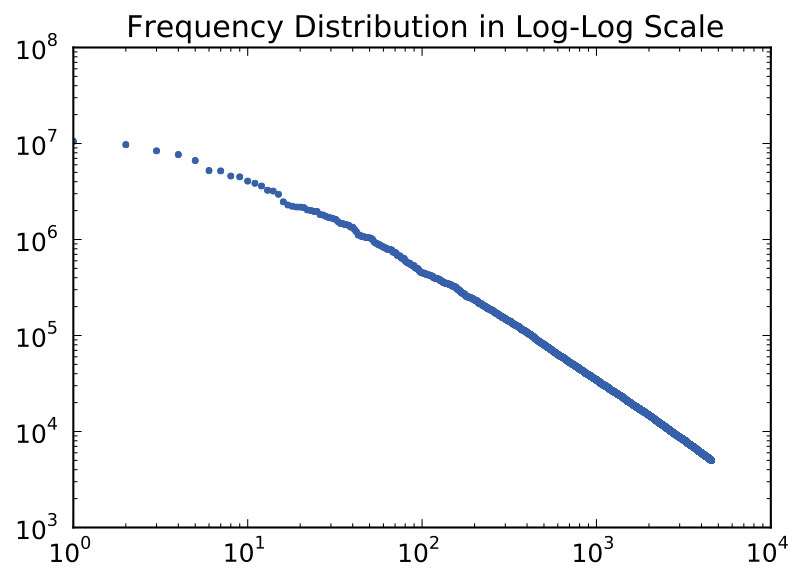
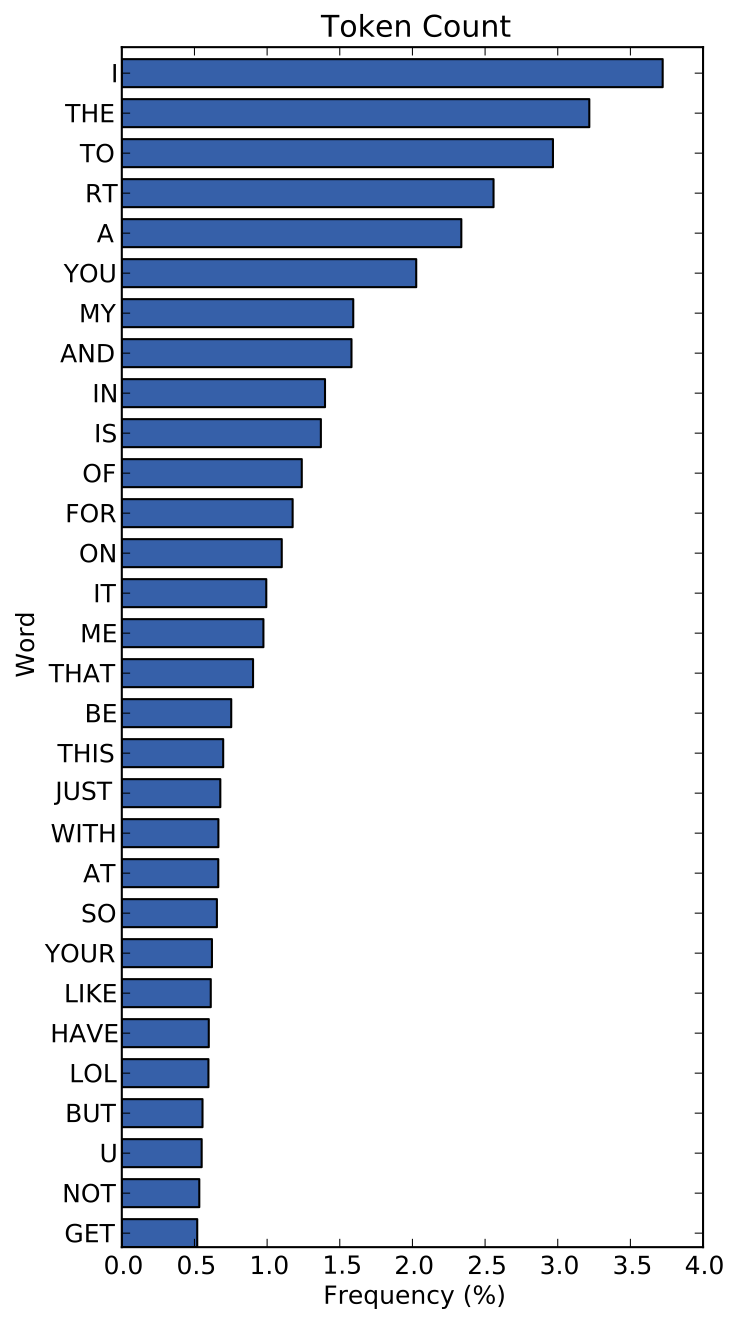
Token Frequency Distribution #106
Comments
|
Advanced option: plot per-class distributions ... |
|
Plot first 50 words if it's a single corpus, otherwise if we're comparing two corpora (e.g. with an overlay), the words on the axis go away? Since it's really just the shape that matters. |
|
Re: comparing across corpora/texts: http://stackoverflow.com/questions/32040444/frequency-distribution-comparison-python |
|
Philosophical questions... Should this class expect text that has been count vectorized? Or use For now, to keep things simple, let's assume the input is a list of list of words (e.g. already preprocessed). Each row is a document which is a list of words, pass documents in as X. Then don't have to worry about tokenization. Then once this is closed, open up a new card to elaborate (import regular expression tokenizer utils - english stopwords, strip accents, strip tags, etc. from sklearn)? |
|
@rebeccabilbro before pushing, remember to rename text.ipynb from examples to avoid PITA merge conflict with @bbengfort |
|
Ok, have pushed a preliminary implementation of the Things that we should do or consider doing in a future implementation:
|
|
Hawt. I just have this voice in the back of my head going "muwahahahahaha" -- every time we implement a new visualizer. They're so simple to use (maybe a bit less simple to implement, but not too bad), but so powerful. The examples you gave show a very clear and intuitive use for a simple frequency distribution, but one that would take a lot of steps to do on your own so you'd probably skip it. YB puts it at your fingertips and looks good doing it! |
Create a
TextFreqDistVisualizer (or something like that) that takes as input aCountVectorizer, a number n of top n most frequent words, and a parameter for cumulative frequency or not. Then on draw, display a frequency distribution plot of the most frequent tokens.The goal of this plot is to show the effect of stopwords removal and other text feature normalization techniques (e.g. stemming vs. lemmatization).
The text was updated successfully, but these errors were encountered: