This project aims to develop an innovative anomaly detection tool that utilizes the Long Short-Term Memory (LSTM) algorithm and AI technology to detect and flag network anomalies. To accomplish its goals, this project will rely on the publicly available CSE-CIC-IDS 2018 dataset. This dataset contains a significant amount of network traffic data captured from a realistic environment, including labeled examples of both normal and anomalous network behavior. By utilizing this dataset, the project can test the effectiveness of its anomaly detection algorithms and refine them as necessary.
The main focus of this project is on the LSTM algorithm, which will be used to analyze and visualize the network traffic data. By leveraging the power of AI, the LSTM algorithm can identify patterns and anomalies in the data that may be difficult for humans to detect. This approach offers an efficient and effective method for detecting network anomalies, which is essential for securing critical network infrastructures against potential attacks.
In conclusion, this project aims to develop an innovative anomaly detection tool that utilizes the LSTM algorithm and AI technology to detect and flag network anomalies. By providing a more intuitive and user-friendly interface for analyzing the results, the tool can be used to secure critical network infrastructures against potential attacks. Ultimately, the success of this project could have far-reaching implications for the field of network security and the protection of vital network infrastructures.

- Python programming language 🐍
- Keras and TensorFlow frameworks for building and training LSTM models 🤖
- Pandas and NumPy libraries for data manipulation and processing 📊
- Matplotlib and Seaborn libraries for data visualization 📈👀
- Jupyter Notebook for interactive data exploration and analysis 📓
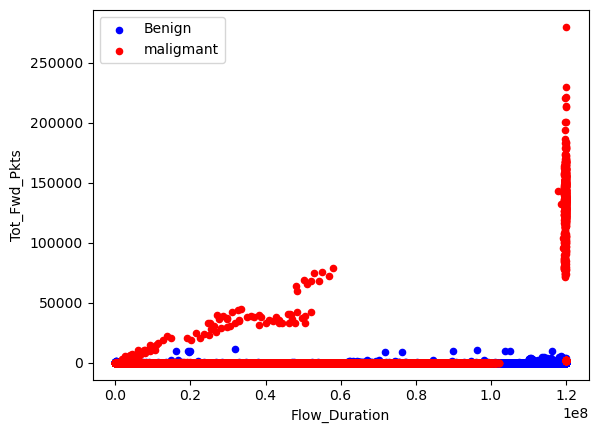
Data relation between Benign and Malignant
To clean and prepare the dataset for training and testing, I first load it into the df variable. Then, I replace spaces with underscores and filter rows related to HTTP and HTTPS traffic. Next, I check for null and infinite values and remove them if any exist. I also check the data type of each column and remove the majority of object columns.
I change the label data as follows: benign is changed to 0 and DDoS attacks is changed to 1. The original dataset had 2089686 rows with only 576191 of them being labeled as 1. I reduce the number of 0 rows to match the number of 1 rows.
Next, I create a duplicate dataset with 15000 rows from the previous dataset for training and testing purposes. In these steps, we are preparing the dataset for training the LSTM model. We first define the sequence length and overlap between sequences, which will be used to generate sequences from the original dataset. We then define a function to generate sequences from the training, validation, and test sets, using the defined sequence length and overlap.
Next, we define another function to pad the generated sequences to ensure they all have the same length, and then apply this function to the sequences in the training, validation, and test sets. After padding the sequences, we reshape the data to the required input shape for LSTM models, which is a three-dimensional tensor of shape (samples, time steps, features).
We then normalize the data by subtracting the mean and dividing by the standard deviation of the training set. This step ensures that the data has zero mean and unit variance, which helps the model to converge faster during training.
Finally, we convert the labels to categorical form, as required by the LSTM model, and convert the data type of both the input features and labels to float32. This completes the data preparation phase, and the dataset is now ready for training the LSTM model.
First, I set the sequence length to 10 and the number of features in the dataset to n_features using the length of the columns in the DataFrame. Then I defined the model architecture for the LSTM model with ReLU activation function. The model includes two LSTM layers, one with 64 units and the other with 32 units, followed by a dropout layer with a rate of 0.2, an activation layer with ReLU activation function, and a dense layer with 2 units and softmax activation function.
After defining the model architecture, I compiled the model with an Adam optimizer and categorical cross-entropy loss function. Then, I printed the shape of the training and validation data and the summary of the model to check the model's architecture and parameters.
Next, I trained the model using the training data, setting the early stopping monitor to 'val_loss', the patience to 10, and the batch size to 16. I also included the validation data and early stopping callback in the training process to avoid overfitting and improve the model's performance. The training process was set to run for a maximum of 100 epochs.
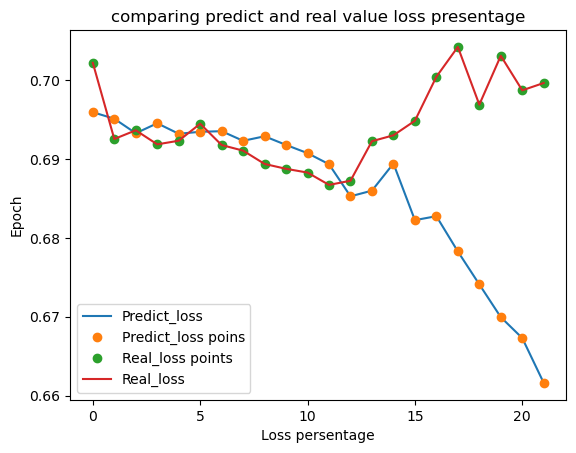
Predict Loss vs Real Loss
The chart shows the comparison between the predicted and real loss percentage values over 20 epochs. The x-axis represents the loss percentage and the y-axis represents the epoch number. The blue line represents the predicted loss values and the orange line represents the real loss values.
At the start of the training, both the predicted and real loss values are relatively high, with the real loss values slightly higher than the predicted loss values. As the number of epochs increases, both the predicted and real loss values decrease, indicating that the model is getting better at making predictions.
However, towards the end of the training, there is a slight increase in the real loss values, while the predicted loss values continue to decrease. This suggests that the model may be overfitting to the training data and is not generalizing well to new data. Overall, the chart shows that the model is making progress in reducing the loss values, but may need further adjustments to improve its performance.
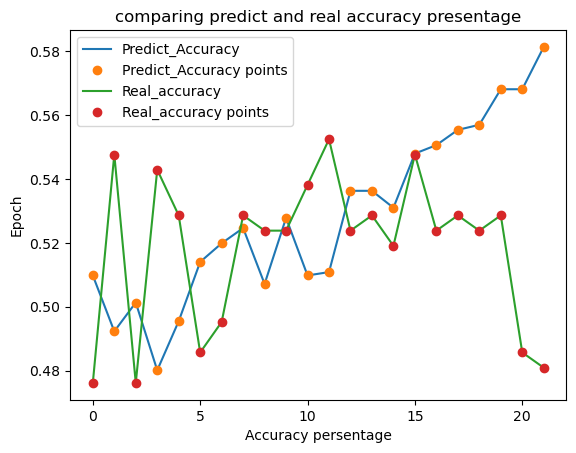
Predict accuracy vs Real accuracy
The chart being described shows the accuracy of a model over 20 epochs, with the model's predicted accuracy plotted against the real accuracy. The chart provides the values for each epoch, with the predicted accuracy and real accuracy shown for each epoch.
From the chart, we can see that the predicted accuracy of the model fluctuates over the 20 epochs, while the real accuracy remains relatively constant, with some slight fluctuations.
At the beginning of the chart, the predicted accuracy is lower than the real accuracy, but as the epochs progress, the predicted accuracy increases and approaches the real accuracy. There are some fluctuations in the predicted accuracy around epochs 5 and 7, where the predicted accuracy is higher than the real accuracy. However, the predicted accuracy continues to increase until it surpasses the real accuracy at around epoch 18.
Overall, the chart shows that the model's predicted accuracy becomes increasingly accurate as the number of epochs increases, eventually surpassing the real accuracy of the model.
Loss and accuracy are two important metrics used to evaluate the performance of machine learning models.
In general, a lower loss indicates that the model is doing a better job of predicting the correct output, while a higher accuracy indicates that the model is making fewer errors. However, it's important to note that loss and accuracy are not always directly correlated.
Looking at the chart provided, we can see that the model's loss decreases over the first several epochs, but then begins to fluctuate and even increase slightly. Meanwhile, the accuracy starts off low but then increases steadily over the course of the 20 epochs.
This suggests that the model may have initially struggled with predicting the correct output, but over time, it improved and became more accurate. However, the fluctuations in the loss may indicate that there is still room for improvement in the model's performance.
Overall, it's important to consider both loss and accuracy when evaluating a machine learning model, as they provide different perspectives on its performance. A model with high accuracy but high loss may still have room for improvement, while a model with low loss but low accuracy may not be generalizing well to new data.
This LSTM-based network intrusion detection project was developed by DuseTrive as a personal project without a supervisor. The following Python libraries were used for data processing, visualization, and machine learning:
Pandas (v1.3.4) - Data manipulation and analysis NumPy (v1.21.4) - Numerical computing TensorFlow (v2.6.0) - Machine learning framework Matplotlib (v3.4.3) - Plotting and visualization Scikit-learn (v1.0) - Machine learning framework
The dataset used in this project is the NSL-KDD dataset, which was obtained from the University of New Brunswick. The dataset contains network traffic data that has been labeled as either normal or malicious. The dataset was preprocessed using the Python libraries mentioned above.
The machine learning model used in this project is an LSTM-based neural network. The model was implemented using the Keras deep learning library. The performance of the model was evaluated using various metrics such as loss and accuracy.
Overall, this project serves as an example of using deep learning algorithms to classify network traffic as either normal or malicious. The insights gained from this project can be used to improve network security and prevent cyber attacks.
This project is licensed under the MIT License.