Run the application with a Service Mesh
This will describe how to run the Pitstop solution using a Service Mesh.
This description assumes you have used Pitstop using Kubernetes (a.k.a. 'k8s') by following the description in Run the application using Kubernetes. If this is not the case, please follow the instructions in this description and you have Pitstop running successfully on Kubernetes to make sure you have satisfied all the prerequisites for running the service-mesh.
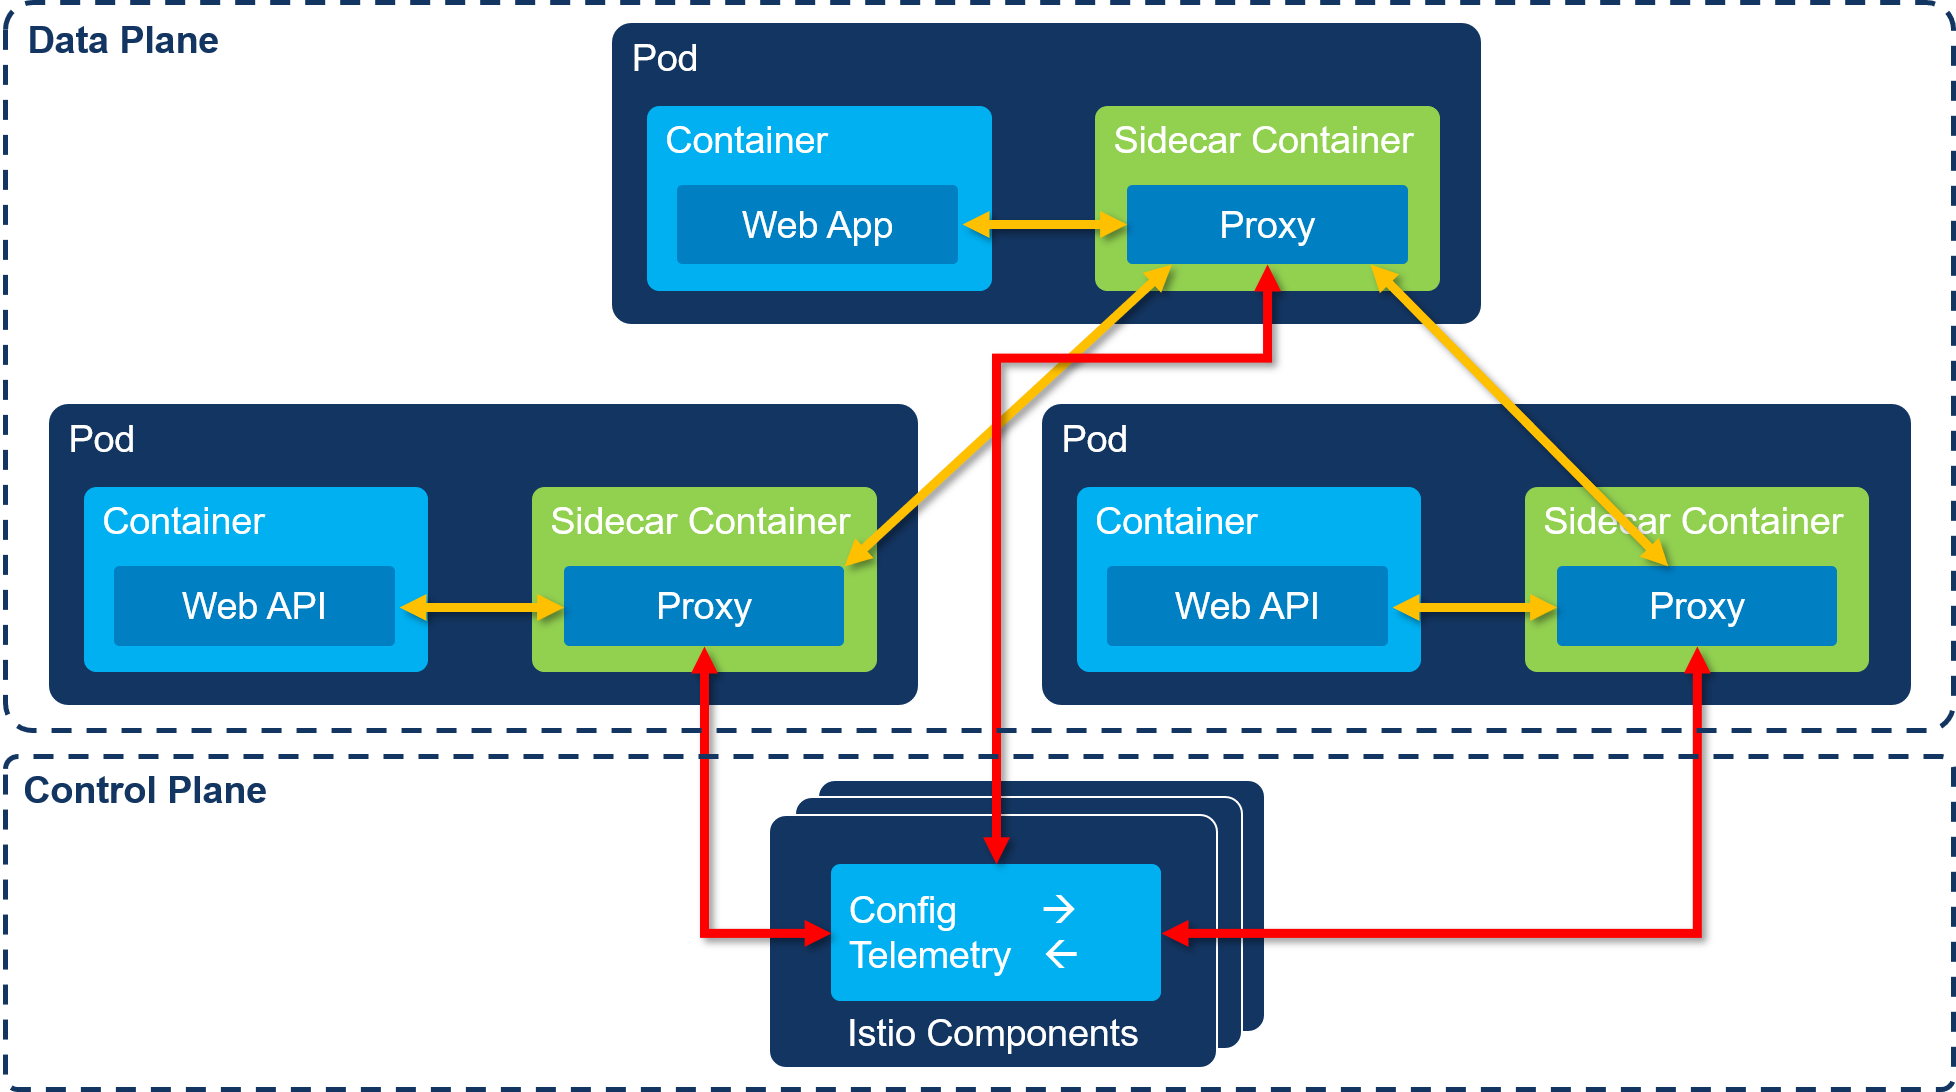
A service mesh is an infra-structure layer that will handle all communication between services in a distributed (or microservices) based system. This enables you to handle all kinds of cross-cutting concerns like: monitoring, security, traffic-routing, resiliency, etcetera. And the cool thing is that it does this on an infrastructure (network) level and it's transparent for you as a developer: you don't have to change anything in your application.
When you add a service mesh to a Kubernetes cluster, it does its magic by injecting a so called side-car container into each pod you specify. This side-car container will handle all incoming and outgoing communication with the container that runs your code (lets call this the app container). We call this 'mesh' of interconnected pods the data plane. This is also referred to as east-west traffic.
A service mesh also contains a control plane. This is formed by the set of components that manage the service mesh. These are containers that run on Kubernetes next to your application. Below you find a schematic overview of what this looks like:
There are several service mesh implementations available, but for Pitsop I've evaluated *Istio and *Linkerd. I will describe how to install both Istio on your Kubernetes cluster and run Pitstop with this service mesh implementation.
Istio is an open-source service mesh implementation that runs on Kubernetes (among others). See https://istio.io for more information.
The repository contains a script for installing Istio into your Kubernetes cluster:
-
Open up a command-prompt and change the current folder to the
src/k8s/istiofolder within the Pitstop repo. -
Issue the following command:
install-istio.ps1on Windows or
install-istio.shon MacOS / Linux.
Execute the following steps to start the application:
-
Open up a command-prompt and change the current folder to the
src/k8s/scriptsfolder within the Pitstop repo. -
Issue the following command:
start-all.ps1 -istio
on Windows or
start-all.sh --istio
on MacOS / Linux.
The start-all script uses the Kubernetes CLI (kubectl) to apply the same Kubernetes config-files as when starting the app using Kubernetes. But by specifying the istio switch on the command-line, the following Istio specific config-files are used:
| Config file | Description |
|---|---|
| sqlserver-istio.yaml | Creates the SQL Server deployment |
| customermanagementapi-v1-istio.yaml | Creates the CustomerManagement v1 deployment |
| customermanagementapi-v2-istio.yaml | Creates the CustomerManagement v2 deployment |
| customermanagementapi-svc.yaml | Creates the CustomerManagement service |
| vehiclemanagementapi-istio.yaml | Creates the VehicleManagement deployment and service |
| workshopmanagementapi-istio.yaml | Creates the WorkshopManagement deployment and service |
| webapp-istio.yaml | Creates the WebApp deployment and service |
These files are similar to the non-mesh versions, but they contain an annotation that will make sure Istio will inject a sidecar container upon deployment:
annotations:
   sidecar.istio.io/inject: "true"
On the Kubernetes cluster, the following setup will be running:


SQL Server is omitted from the diagrams to prevent cluttering. The focus is on the Web App and API services.
You can check whether or not the application was started successfully using the Kubernetes CLI. Execute the following command: kubectl get pods -n pitstop. This will show you an overview of all the pods that are started in the Pitstop namespace. You should see something like this:

It could take some time for pods to get up & running so you could see some other statuses in the list.
Follow the steps below to test the application functionality:
- Follow the steps described in Testing the application to test the application functionality.
- See Logging to learn how to get to the application logging.
- In the logging you might see some errors during start-up. See Resiliency to learn where these errors are coming from.
Now we are running the app with Istio as service mesh, we get a lot of additional capabilities. Some of them will be described below.
Istio offers several ways of looking at traffic using different monitoring capabilities (additionally to the default Kubernetes dashboard). The dashboards we will look at are: Grafana and Kiali.
In order to use the Istio monitoring tools, you need to forward some ports. I have created a script to do this for the Kubernetes Dashboard and the the Istio dashboards:
-
Open up a command-prompt and change the current folder to the
src/k8s/istiofolder within the Pitstop repo. -
Issue the following command:
start-dashboards.ps1on Windows or
start-dashboards.shon Linux.
This will make sure you can access all the dashboards (including the Kubernetes dashboard).
You can examine the start-dashboards script to see how to expose ports for using the dashboards.
Grafana will give you deep insight into the traffic and workloads running on the service mesh.
In order to access Grafana, open the following url in a browser: http://localhost:3000/dashboard/db/istio-mesh-dashboard.
See the Istio Grafana documentation on how to navigate the various dashboards.
Kiali is another dashboard that will give you deep insight into the traffic and workloads running on the service mesh. A specific feature in Kiali that is pretty helpfull in understanding your application topology is the Graph view. This will create a visual graph of your application topology based on the metrics reported by the sidecars:

As you can see, the graph also indicates error in the topology. In the example image, the VehicleManagementAPI service is not available and returns HTTP status-codes 500 (error).
In order to access Kiali, open the following url in a browser: http://localhost:20001/kiali/console. When you are prompted to login, use user-name: admin and password: admin.
See the Istio Kiali documentation on how to navigate the various dashboards.
You can use Istio for routing traffic through you app components. This enables all kinds of interesting scenarios often wanted in DevOps situations, some of which are:
- Dark releasing
- Canary releasing
- A/B testing
- Chaos engineering for testing resiliency
In order to experiment with some of these capabilities, I've added a v2 of the CustomerManagementAPI service to Pitstop. This version will return an additional field in the customer-data that indicates the customer loyalty-status based on historical sales (bronze, silver or gold). The web-app has been altered to be able to show this information on the customer details screen. A medal is shown indicating the loyalty-status.
In the next couple of steps you will use Istio to release the v2 into "production" gradually. Make sure you have the application running as described above.
In order to test the traffic-routing capabilities of Istio, we will start a load-test that automatically sends requests to the web-app. When a tab is opened, a requests will be sent to the corresponding API service to get the list of items (customers, vehicles and maintenance-jobs). The load-test will hit these tabs with random intervals to simulate end-users using the web-app,
If you haven't added any data into the Pitstop web-app, first you need to do that:
- Open a browser and open the Pitstop web-app (http://localhost:7005).
- Add a random customer.
- Add a random vehicle.
- Add a maintenance-job for the added vehicle.
Execute the following steps to start the load-test.
-
Open a command-prompt and change the current folder to the
src/k8s/scriptsfolder within the Pitstop repo. -
Start the load-test by executing the command:
start-loadtest lt
The load-test will hit all URIs defined in the file loadtest-uris.txt in the k8s folder in parallel with random intervals.
In order to see what's going on in our cluster, we will use Kiali. Execute the following steps to open the Kiali graph:
- Open a browser and navigate to http://localhost:20001/kiali/console. When you are prompted to login, use user-name:
adminand password:admin. - Select the Pitstop namespace.
- Select Versioned App Graph display mode.
- Select Traffic Animation from the Display drop-down. You will see the traffic from the load-test flowing though the components.
- Select Requests percentage in the edge-labels drop-down. You will actually see the percentages of traffic flowing through the application.
- Hide the rabbitmq and logserver by typing
name = logserver or name = rabbitmqin the Hide... textbox.

Leave the Kiali graph open, we will revisit this screen regularly in the next steps.
In order to deploy v2 of the CustomerManagementAPI, execute the following steps:
-
Open a command-prompt and change the current folder to the
src/k8sfolder within the Pitstop repo. -
Deploy the V2 deployment using kubectl:
kubectl apply -f customermanagementapi-v2-istio.yaml
-
Open the Kiali graph and wait until the CustomerManagementAPI v2 deployment appears. You will see some traffic from v2 to the database. This is the CustomerManagementAPI checking whether the necessary database and tables are available in the database. After some time the traffic from v2 will stop.
Why is no traffic flowing to v2 you might ask yourself. Well, this is because this CustomerManagementAPI service explicitly uses 'version: v1' in its label selector:
selector:
   system: pitstop
   app: customermanagementapi
   version: v1
This means it will only forward traffic to v1. We will change this later.
By executing the previous step, you've basically dark-released CustomerManagementAPI v2. It is running in the cluster but takes no traffic and does nothing yet. Wouldn't it be valuable if we could send some traffic to v2 and monitor its behavior using the monitoring capabilities of Istio - without impacting any end-users!? Well, this is possible.
Istio offers so called 'virtual services'. A virtual service can be applied to a Kubernetes service and conceptually overlay it. It can than augment the behavior of the service and shape the traffic going through it. One thing a virtual service can do is mirror traffic coming into a service onto a deployment. The nice thing about this, is that the deployment will receive actual user-traffic, but no responses are sent back to the end-user. They won't even notice an additional version is deployed.
Always be cautious of any side-effects caused by a component that you dark release! If that component alters data in a back-end system or database, this could obviously impact the end-user. One solution could be to point the dark released component to a different test back-end system or database during the tests. In our case, we will only test queries so this is not an issue.
Execute the following steps to enable mirroring of traffic to CustomerManagementAPI V2:
-
Open a command-prompt and change the current folder to the
src/k8sfolder within the Pitstop repo. -
Deploy the virtual service that mirrors traffic using kubectl:
kubectl apply -f customermanagementapi-mirror.yaml
Check out the yaml file to see how this is defined.
-
Watch the graph in Kiali. You will not see any traffic to or from CustomerManagementAPI v2. This is because the underlying Kubernetes service is still only routing traffic to v1. We will change that now.
-
Remove the
version: v1from thecustomermanagementapi-svc.yamlfile so it looks like this:selector: system: pitstop app: customermanagementapi
-
Save the file and apply it to the Kubernetes cluster using kubetcl:
kubectl apply -f customermanagementapi-svc.yaml
-
Check the Kiali graph and notice traffic flowing from the CustomerManagementAPI v2 deployment to the back-end database. Also notice that there's no traffic between the CustomerManagementAPI service and the v2 deployment.
You've now dark-released CustomerManagementAPI v2! If you go to the Pitstop web-app and open the details of a customer on the customer-tab, you will not see a medal indicating the customer's loyalty-status (you can refresh a couple of times). This is because no responses flow back from the CustomerManagementAPI v2 to the end-user.
Now that we know the CustomerManagementAPI v2 can handle traffic without any errors showing up, we want to canary release it. This means we will actually make sure traffic from the end-users is sent to v2 and responses are sent back. But because we're not 100% sure the service doesn't have any bugs, we want to release it to a small selection of the end-users. This ensures that when it does have some bug that has impact on end-users, only a small percentage of the users are impacted.
To test this with Pitstop, we want to send 10% of traffic to CustomerManagementAPI v2 and 90% to CustomerManagementAPI v1. Execute the following steps to canary-release the CustomerManagementAPI v2:
-
Open a command-prompt and change the current folder to the
src/k8sfolder within the Pitstop repo. -
Deploy the virtual service using kubectl:
kubectl apply -f customermanagementapi-canary.yaml
Check out the yaml file to see how this is defined. Notice that the name of the virtual service is equal to that used in the mirroring scenario. By doing this, we simply replace the mirroring behavior with the load-balancing behavior.
-
Watch the graph in Kiali. You will see traffic flowing to both CustomerManagementAPI v1 and v2.
-
If you wait for some time, the traffic division will actually reach 90% to v1 and 10% to v2.
You've now canary-released CustomerManagementAPI v2! If you go to the Pitstop web-app and open the details of a customer on the customer-tab, you will occasionally see a medal indicating the customer's loyalty-status (you have to refresh a couple of times).
If you're convinced that the v2 does not introduce any issues, you can fully release it into production. To do this, we simply can remove the Istio virtual service. Do this by executing the following steps:
-
Open a command-prompt and change the current folder to the
src/k8sfolder within the Pitstop repo. -
Remove the Istio virtual service using kubectl:
kubectl delete virtualservice customermanagementapi -n pitstop
By deleting the Istio virtual service, the underlying Kubernetes service will resume its standard behavior. This is load-balacing round-robin over all the connected deployments (based on the label selector). Because this does not include the version label anymore, traffic will be load-balanced between v1 and v2 equally (50% / 50%). If you look at the graph in Kiali you can see the percentages (if you have selected Requests percentage in the edge-labels drop-down).
If you go to the Pitstop web-app and open the details of a customer on the customer-tab, you will see a medal indicating the customer's loyalty-status in about 50% of the time (you have to refresh a couple of times).
To stop all the Pitstop components, execute the script stop-all.ps1 or stop-all.sh in the src/k8s/scripts folder. This script will use kubectl to delete all the Pitstop components from the cluster. Give all the pods some time to terminate. You can check whether or not everything has been deleted by getting all components in the Pitstop namespace:
kubectl get pods -n pitstopThe repository contains a script for completely removing Istio from your Kubernetes cluster:
-
Open up a command-prompt and change the current folder to the
src/k8s/istiofolder within the Pitstop repo. -
Issue the following command:
uninstall-istio.ps1on Windows or
uninstall-istio.shon MacOS / Linux.
If you want to see what I've described here in action, watch the dotnetFlix video I've recorded about this or the recording of my talk about this at DotNext St. Petersburg in May 2019.
Linkerd is an open-source service mesh implementation that runs on Kubernetes (among others). See https://linkerd.io for more information.
I advise you to uninstall Istio from you Kubernetes cluster when you want to use Linkerd. Although both meshes can run side-by-side, it will save you a lot of CPU and memory when you uninstall Istio.
- Download the latest stable Linkerd CLI from the Linkerd releases page on GitHub.
- Extract the archive into a folder.
- Make sure you can access this folder from anywhere (e.g. add it the the global
Pathenvironment-variable in Windows).
Before we can use the Linkerd service-mesh, we need to add several Linkerd components to our Kubernetes cluster.
-
Open a command-prompt.
-
Validate your Kubernetes cluster:
linkerd check --preIf checks are not succesful, check out the Linkerd documentation for troubleshooting tips.
-
Install the Linkerd Custom Resource Definitions:
linkerd install --crds | kubectl apply -f -
-
Install the Linkerd control-plane:
linkerd install | kubectl apply -f -
-
Check whether the installation was successfull:
linkerd check
By default, observability tools (dashboards) are not installed with Linkerd. For making sure we can see what's going on with our application, we install the necessary observability tools.
-
Install the Linkerd Dashboard:
linkerd viz install | kubectl apply -f -
-
Check the installation:
linkerd check
Now you can start the Linkerd dashboard by executing the following command:
linkerd viz dashboard &Execute the following steps to start the application:
-
Open up a command-prompt and change the current folder to the
src/k8s/scriptsfolder within the Pitstop repo. -
Issue the following command:
start-all.ps1 -linkerd
on Windows or
start-all.sh --linkerd
on Linux.
The start-all script uses the Kubernetes CLI (kubectl) to apply the same Kubernetes config-files as when starting the app using Kubernetes. But by specifying the linkerd switch on the command-line, the following Istio specific config-files are used:
| Config file | Description |
|---|---|
| customermanagementapi-v1-linkerd.yaml | Creates the CustomerManagement v1 deployment |
| customermanagementapi-v2-linkerd.yaml | Creates the CustomerManagement v2 deployment |
| customermanagementapi-svc.yaml | Creates the CustomerManagement service |
| vehiclemanagementapi-linkerd.yaml | Creates the VehicleManagement deployment and service |
| workshopmanagementapi-linkerd.yaml | Creates the WorkshopManagement deployment and service |
| webapp-linkerd.yaml | Creates the WebApp deployment and service |
These files are similar to the non-mesh versions, but they contain an annotation that will make sure Linkerd will inject a sidecar container upon deployment:
annotations:
   linkerd.io/inject: enabled
On the Kubernetes cluster, the following setup will be running:

Follow the steps below to test the application functionality:
- Follow the steps described in Testing the application to test the application functionality.
- See Logging to learn how to get to the application logging.
- In the logging you might see some errors during start-up. See Resiliency to learn where these errors are coming from.
You can start the Linkerd Dashboard to see the service-mesh metrics:
linkerd viz dashboard &