Open University Learning Analytics Dataset (OULAD) analysis exercise.
The OULAD dataset contains open source, anonymized data of students, courses, assessments, and virtual learning environments (VLE) clickstreams, allowing for analyses into the nexus of student behavior and outcomes.
- What are important predictors for negative course outcomes? (when
final_resultiswithdraworfail)
- Initial data cleaning and ETL --> creates initial master dataframes
- Read in raw csv files and save as dataframes in
data_dictdictionary - Initial EDA on raw data - creates summary of each dataframe, dimensions, missing rows, and column names
- Creates master dataframes for each of the research questions
- Read in raw csv files and save as dataframes in
- Additional data cleaning --> Creates cleaned dataframes
- Check for missing values
- Drop columns where all values are null
- Drop records with missing values in non-numeric columns
- Impute 0 value into missing values in numeric columns
- Check for duplicates rows, drop duplicates if applicable
- Check for outliers for numeric variables and cap outliers at the 98th percentile (since data are right skewed)
- Prep VLE data by aggregating number of days and clicks for each VLE medium and total so that there are aggregated metrics for each student/course/semester
- Feature engineering
- Create
yearandsemestercolumns fromcode_presentation - Label encode categorical columns
- Create
overall_total_clicksper student/course/semester
- Create
- EDA and descriptive analyses
- Explore univariate patterns: Create histograms for numeric variables and bar plots for categorical variables
- Explore bivariate relationships:
- Create correlation matrix for all numeric variables
- Create stacked bar plots by
final_resultgroup for categorical variables - Create grouped box plots by
final_resultgroup for numeric variables and group box plots forscorevalues by categorical variables - Create scatter plots for
scoresand numeric variables - Create VLE summary info to explore average values and student utilization (percentage) for each VLE medium
- Predictive modeling
- Run grid search to determine optimial hyperparameters for model, using 5-fold CV
- Save hyperparameters to use for final model
- Split training and test sets (80:20)
- Train final random forest model (classifier for RQ1 and regressor for RQ2)
- Run model predictions on test data set and use results to measure final model performance
- Model evaluation
- Performance metrics determined and saved to
resultsdictionary output- RQ1 - f1 score, AUC score, confusion matrix
- RQ2 - MSE, and R2
- Feature importances from RF output
- Performance metrics determined and saved to
Note - Random forests were used because they are robust against multicollinearity and skewness
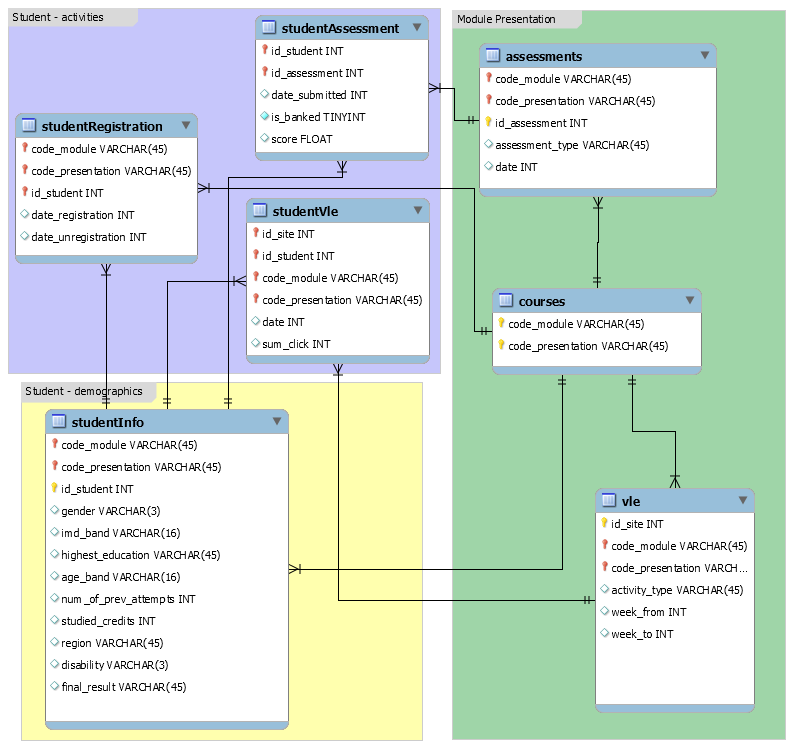
Raw data summary
| Table | Row, Cols | Missing rows | Column names |
|---|---|---|---|
| assessments | 206, 6 | 11 | ['code_module', 'code_presentation', 'id_assessment', 'assessment_type', 'date', 'weight'] |
| courses | 22, 3 | 0 | ['code_module', 'code_presentation', 'module_presentation_length'] |
| studentAssessment | 173912, 5 | 173 | ['id_assessment', 'id_student', 'date_submitted', 'is_banked', 'score'] |
| studentInfo | 32593, 12 | 1111 | ['code_module', 'code_presentation', 'id_student', 'gender', 'region', 'highest_education', 'imd_band', 'age_band', 'num_of_prev_attempts', 'studied_credits', 'disability', 'final_result'] |
| studentRegistration | 32593, 5 | 22560 | ['code_module', 'code_presentation', 'id_student', 'date_registration', 'date_unregistration'] |
| studentVLE | 10655280, 6 | 0 | ['code_module', 'code_presentation', 'id_student', 'id_site', 'date', 'sum_click'] |
| vle | 6364, 6 | 5243 | ['id_site', 'code_module', 'code_presentation', 'activity_type', 'week_from', 'week_to'] |
Cleaned data for RQ1
- 28,174 records (1 row for each student/course/semester)
- 25,149 unique students, 7 courses from 2 semesters across 2 years (2013 and 2014)
- Outcome variable =
final_result(i.e., pass, withdraw, fail, distinction) - 42% Pass, 23% Fail, 10% Distinction, 25% Withdraw
- Data includes aggregated VLE information about student behavior from whole course duration
Notable univariate notes from EDA
- Most VLE variables, number of previous course attempts, were heavily right skewed
- Relatively equal split of gender representation and IMD bands
- Majority of students were between 0 and 35, majority did NOT have a disability
- Majority of students passed the course
Notable bivariate EDA notes
final_resultsrelationships:- Students with no formal higher education had the lowest pass and distinction rates, and the highest rates of failing and withdrawing
- Subtle positive relationship between passing and IMD band, such that the higher the IMD band, the higher the rate of passing and lower the rate of failing
- Positive outcomes seem to increase by age band
- Students with a disability have higher withdraw rates
- VLE – course performance seems to be positively related to number of days student interacted with the VLE and the average total clicks they used in the VLE
scorerelationships:- Distribution of test scores differed by course,but not by semester/year, gender, region
- Students with post-grad education had higher assessment performances
- Subtle positive relationship between score and IMD band, such that the higher the IMD band, the higher the score
- Positive relationship between score and age band
- Students with a disability have slightly lower scores
- Accuracy = 0.83
- F1 score = 0.81
- ROC AUC = 0.83
Based on feature importances and Shapley value outputs, the total number of distinct days that students
interacted with the VLE was the most impactful predictor on final_result (followed closely by n_days_homepage, overall_total_clicks, and n_days_quiz).
- Did not examine bivariate relationships using statistical tests (e.g., t-test, chi-square, correlations, ANOVA)
- Did not account for lagged effects of VLE interactions in relation to assessment dates
- Limited information on certain fields (e.g., imd_band)
- Did not explore multivariate relationships
- Did not run comparative tests using other ML approaches for comparison (e.g., XGBoost, OLS regression, baysian regression)
- Did not explore dimensionality reduction (e.g., PCA or clustering methods) to consolidate variance from VLE fields
- Poor performance on RQ2 was not evaluated in detailed to improve upon. Could perform a residual analysis to discover what types of feature engineering and tuning could improve performance.
- Try one hot encoding (drop_first=True) for
course_modulesince not ordinal