You signed in with another tab or window. Reload to refresh your session.You signed out in another tab or window. Reload to refresh your session.You switched accounts on another tab or window. Reload to refresh your session.Dismiss alert
I am trying to do some tracing measurements for [binocle][1]. However, when I use tracing with puffin (+puffin_http + viewer), there is a significant slowdown and most scopes do not show.
cargo run --example create_test_file
cargo run --features trace -- binocle_test_file
Could you please help me and tell me what I might have done wrong?
I know that the Binocle::draw method is using most of the time. (And yes, some work should move to a different thread, but I'd like some measurements first.) However, it only gets called if there is a RedrawRequest event, so it doesn't show in the trace viewer.
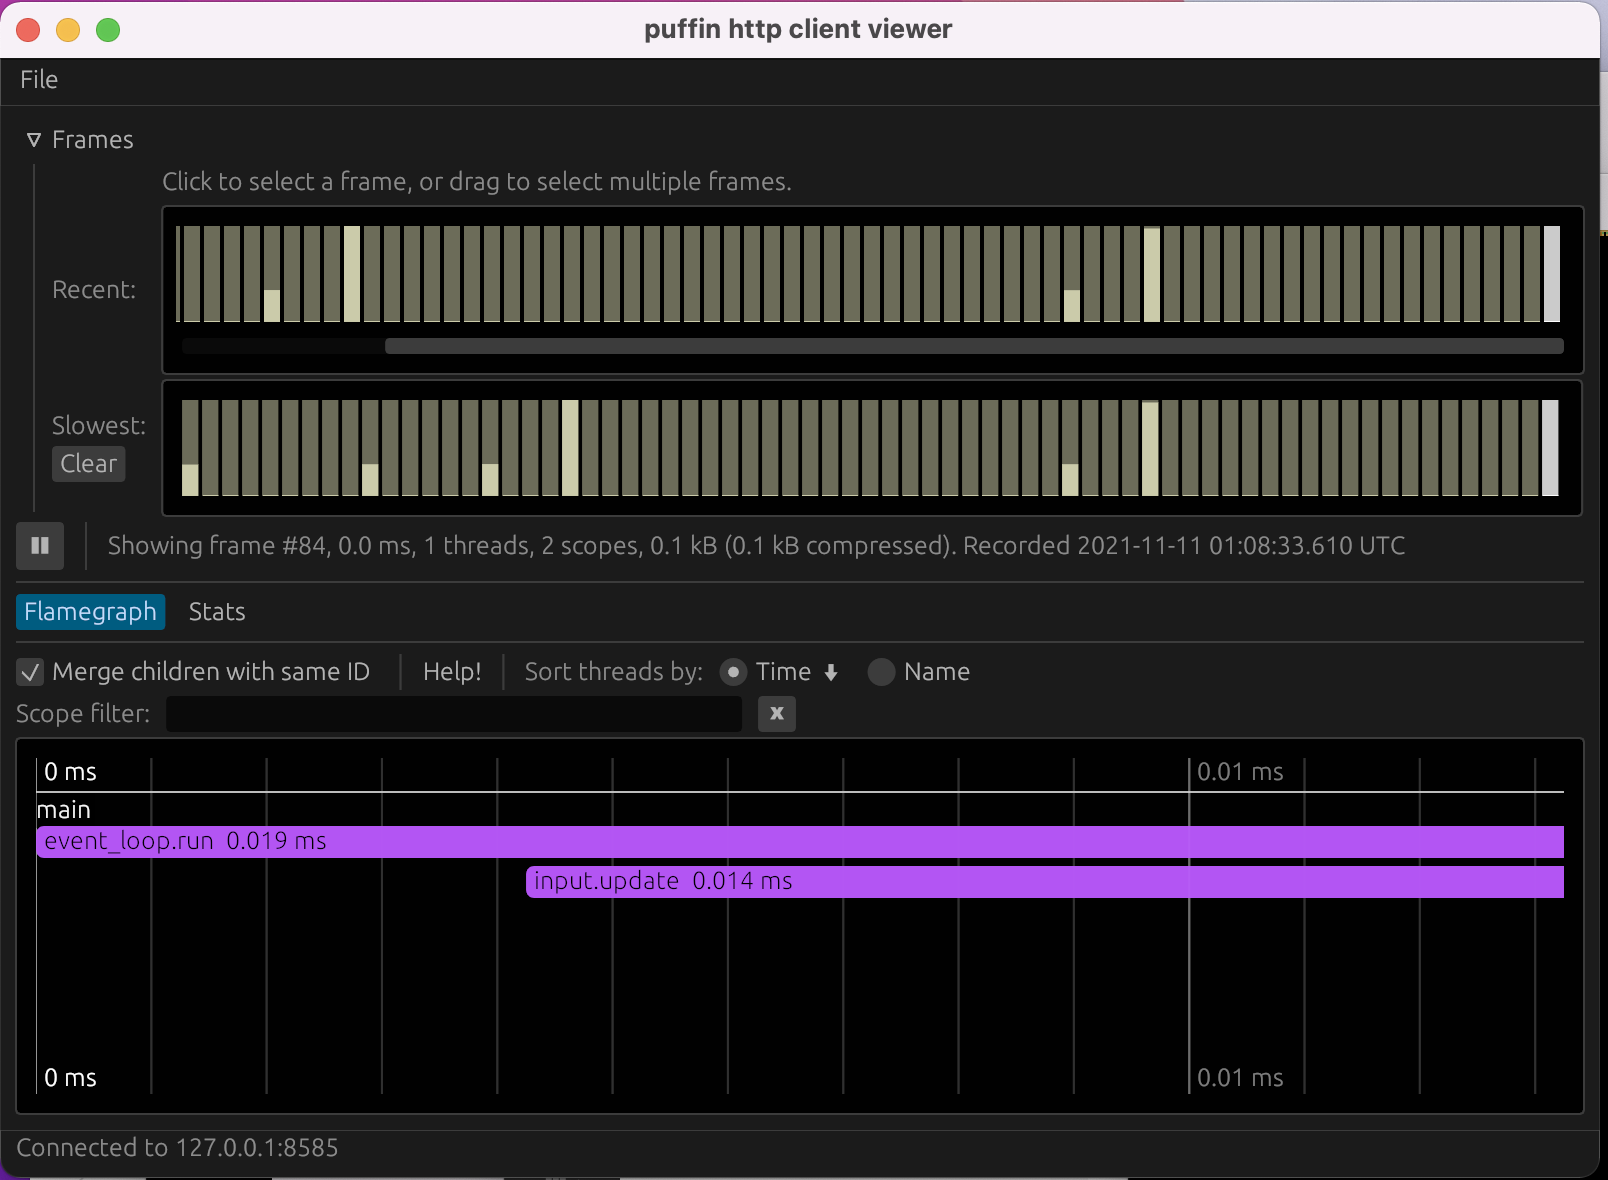
With puffin::GlobalProfiler::lock().new_frame(); in the main loop:
And now with puffin::GlobalProfiler::lock().new_frame(); just inside the if let Event::RedrawRequested(_) = event:
Any ideas? Many thanks (also feel free to close, if this isn't the right venue).
The text was updated successfully, but these errors were encountered:
If you call puffin::GlobalProfiler::lock().new_frame(); right inside event_loop.run you will be calling it for every new event that is received, which will mean each event will be treated as a new "frame", which is likely not what you want.
Calling it on RedrawRequested seems far more sensible.
As noted in the readme, each puffin profile scope costs 100-200 ns, so creating one for each pixel is a bad idea. Puffin is meant for more coarse-grained profiling.
Thank you for this awesome project!
I am trying to do some tracing measurements for [binocle][1]. However, when I use tracing with puffin (+puffin_http + viewer), there is a significant slowdown and most scopes do not show.
I prepared a branch which you can run: https://github.com/siedentop/binocle/tree/feature/eframe
Could you please help me and tell me what I might have done wrong?
I know that the
Binocle::drawmethod is using most of the time. (And yes, some work should move to a different thread, but I'd like some measurements first.) However, it only gets called if there is aRedrawRequestevent, so it doesn't show in the trace viewer.With

puffin::GlobalProfiler::lock().new_frame();in the main loop:And now with
puffin::GlobalProfiler::lock().new_frame();just inside theif let Event::RedrawRequested(_) = event:Any ideas? Many thanks (also feel free to close, if this isn't the right venue).
The text was updated successfully, but these errors were encountered: