Database SQL performance summary from the Automatic Workload Repository (AWR) tables to give an overview of top SQL load and performance issues. The report shows the summarized execution stats such as elapsed time and IO figures for a certain timeframe for individual SQL_ID and plan hash value combinations. All IO figures are shown in MB.
Parameter 'Level' can be switched to aggregate data either by Module or by individual SQL and to show summarised figures or to split them by day. Parameter 'Time Restriction' can be set to show either daytime or nightbatch figures only.
For SQL IO tuning or database server load optimization, a sorting by IO is recommended to show the most IO intensive SQLs on top. Non server or SQL IO related performance bottlenecks, such as wait time caused by Network e.g. 'SQL*Net message from dblink', can be spotted when sorting by 'elapsed time' instead of IO.
Columns:
- Responsibility: Derived from the SGA's action column for initialized EBS sessions.
- Module Name: Derived from the SGA's module column for initialized EBS sessions.
- Module: SGA's module. Please note that if the same SQL is executed by different modules, it appears only once in this report. Thus, the module name column could be misleading as it shows the name of the first module parsing the SQL only. -Code and Code Line#: Code package and line number of the SQL, in case it is still in the cursor cache -Sql Id: Hash identifier for an individual SQL. -Plan Hash Value: Hash identifier for one particular execution plan. Please note that similar but different SQLs might share exactly the same plan hash value if their execution path is identical. -Sql Text -Executions: Total number of executions -Elapsed Time: Total elapsed time in seconds -Time: Total elapsed time in a readable format split into days, hours, minutes and seconds -User Io Wait Time: Total elapsed time in seconds from wait event class 'User I/O' -Cpu Time: Total elapsed time in seconds that the SQL spent on CPU. High figures here usually indicate that massive amounts of data are read from the buffer cache -Plsql Exec Time: Total elapsed time in seconds for PLSQL execution -Concurrency Wait Time: Total elapsed time in seconds from wait event class 'Concurrency' e.g. 'buffer busy waits' or 'enq: TX - index contention' -Application Wait Time: Total elapsed time in seconds from wait event class 'Application' e.g. 'enq: TX - row lock contention', an uncommitted session's update blocking another session. -Time Exec: Average elapsed time per execution -Buffer IO: Total buffer IO in megabtes. This is the most important figure to look at from a server load perspective. -Disk IO: Total physical IO -IO Exec: Total IO per execution. -Rows Exec: Average number of rows per execution -IO Row: Average IO per individual row retrieved. For data extraction SQLs without any sort of data aggregation, the average IO per row is a good indication if the IO spent is reasonable or if the SQL executes efficiently or not. -IO Sec: Average IO in MB per second during SQL execution time. -IO Sec Avg: Average IO in MB per second per overall server time (to indicate the average IO server load of the individual SQL). -Execs Per Hour: Number of SQL executions per hour -Time Percentage: Average percentage of the overall server time that the SQL is running. 50% indicates a SQL is running half of the server time, 400% means the same SQL is running constantly 4 times in parallel -Is Bind Sensitive: Indicates the DB's 'adaptive cursor sharing' feature. A value of 'Y' means, the DB might consider a different explainplan for different bind values. Note that for transactional SQLs such as the ones used by Oracle EBS, the execution path should usually not change. Thus, a value of 'Y' often indicates 'instable' SQLs or SQLs where the optimizer struggles to find the best execution path. -Is Bind Aware: 'adaptive cursor sharing' feature. A value of 'Y' means, the DB considers a differ
SQL Text contains, Module Type, Module contains, SQL Id, Plan Hash Value, Show Bind Values, Schema, Package Name starts with, Date From, Date To, Request Id (Time Restriction), Daytime or Night hours, Day of Week, Level, Order By, Exclude PLSQL Code, Diagnostic Pack enabled, Container Data
obj$, dba_hist_snapshot, dba_hist_sqlstat, dba_hist_sqltext, wrh$_sqlstat, wrh$_sql_bind_metadata, gv$sqlarea, v$parameter
If you would like to try one of these Oracle EBS SQLs without having Blitz Report installed, note that some of the reports require functions from utility package xxen_util.
DBA AWR SQL Performance Summary 25-Jan-2019 160632.xlsx
www.enginatics.com/reports/dba-awr-sql-performance-summary/
Blitz Report™ import options
DBA_AWR_SQL_Performance_Summary.xml
Oracle E-Business Suite Reporting Library
We provide an open source Oracle EBS SQLs as a part of operational and project implementation support toolkits for rapid Excel reports generation.
Blitz Report™ is based on Oracle EBS forms technology, and hence requires minimal training. There are no data or performance limitations since the output files are created directly from the database without going through intermediate file formats such as XML.
Blitz Report can be used as BI Publisher and Oracle Discoverer replacement tool. Standard Oracle BI Publisher and Discoverer reports can also be imported into Blitz Report for immediate output to Excel. Typically, reports can be created and version tracked within hours instead of days. The concurrent request output automatically opens upon completion without the need for re-formatting.
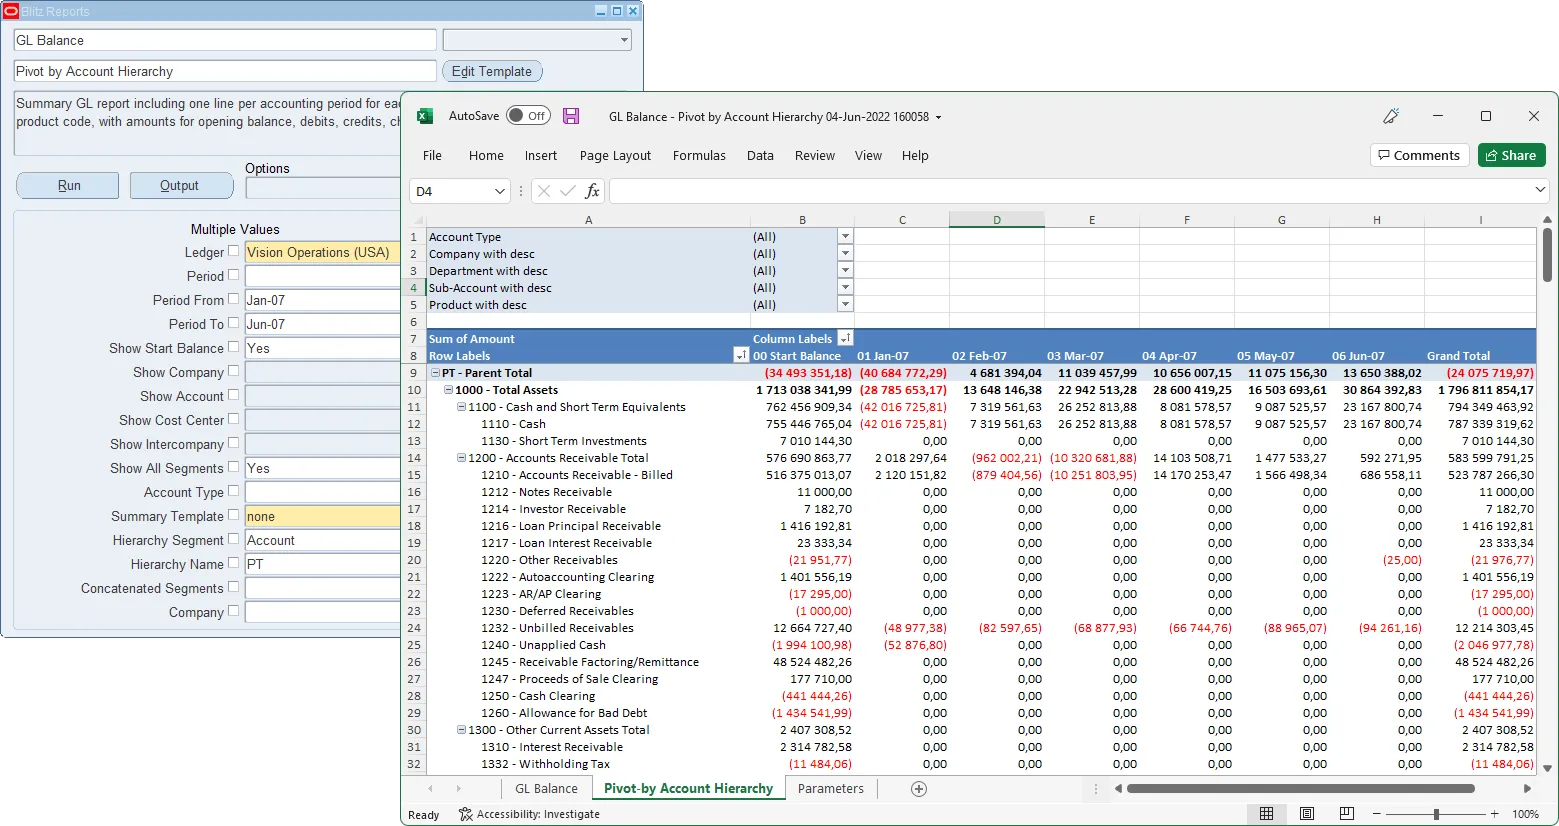
The Filters, Columns, Rows and Values fields are used to create and deliver the data in pivot table format with full drill down to details.
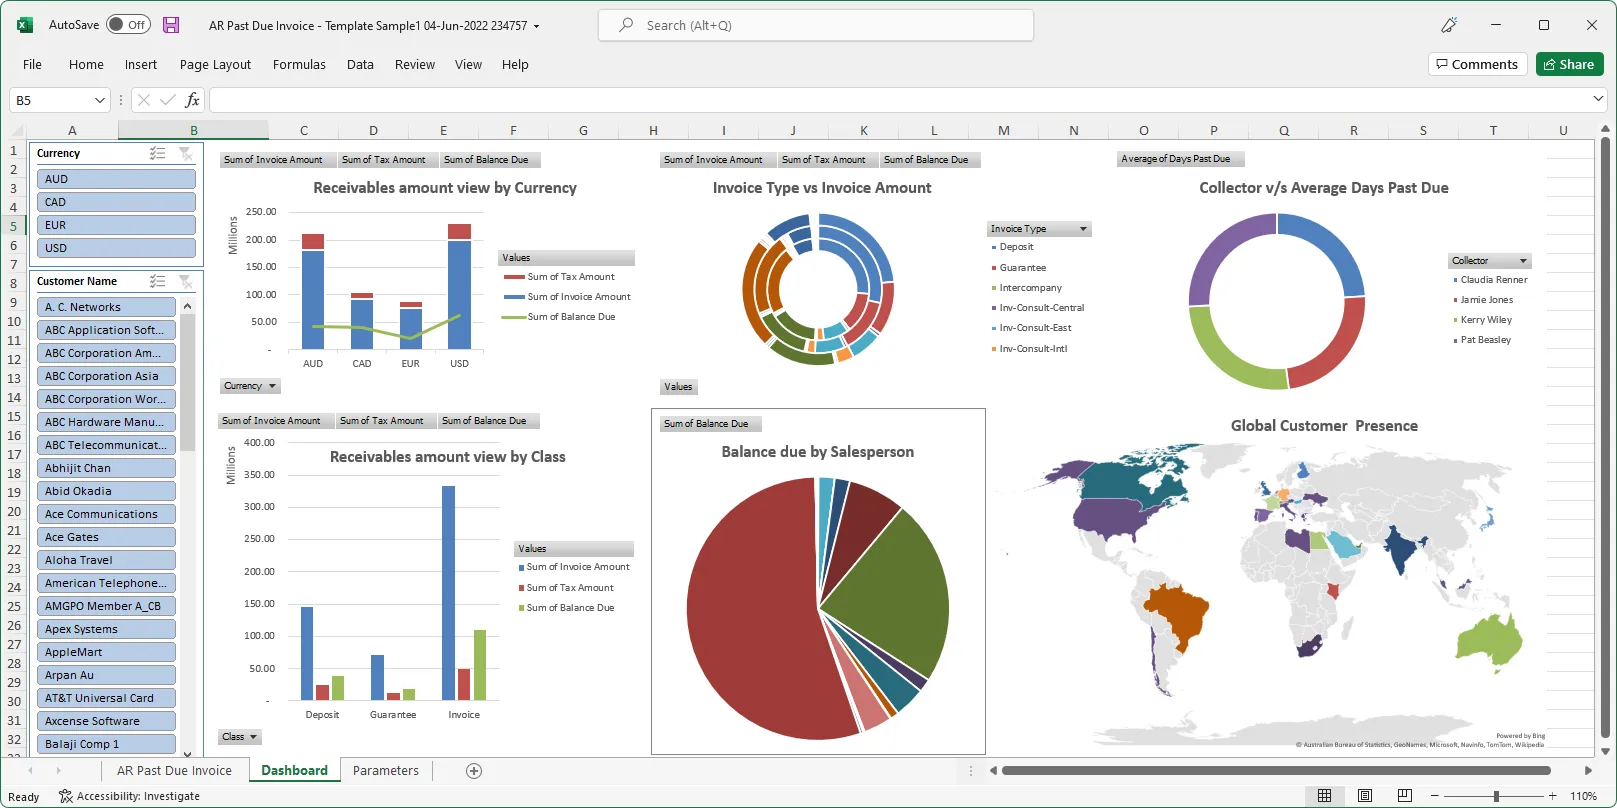
The Excel template upload functionality in Blitz Report allows users to create their own layouts by uploading an Excel template with additional sheets and charts, automatically refreshed when the report runs again. This allows to create custom dashboards and more advanced visualizations of report data.
You can download and use Blitz Report free of charge for your first 30 reports.
The installation and implementation process usually takes less than 1 hour; you can refer to our installation and user guides for specific details.
If you would like to optimize your Oracle EBS implementation and or operational reporting you can visit www.enginatics.com to review great ideas and example usage in blog. Or why not try for yourself in our demo environment.
Blitz Report™ – World’s fastest reporting and data upload for Oracle EBS
Oracle Discoverer replacement – importing worksheets into Blitz Report™
Supply Chain Hub by Blitz Report™
© 2024 Enginatics