| id | title |
|---|---|
bigwig |
Wiggle/BigWig Tracks |
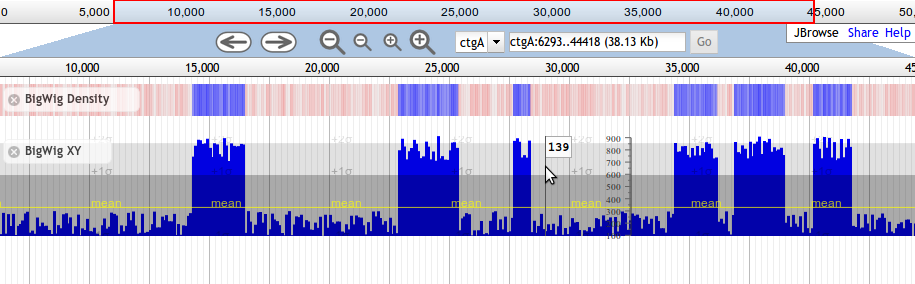
JBrowse offers two available subtypes of Wiggle tracks, Wiggle/XYPlot and Wiggle/Density. The XYPlot wiggle track displays quantitative data as an x/y plot, and the Density displays the data as varying intensities of color.
Here is an example track configuration stanza for a Wiggle XY-plot track displaying data directly from a BigWig file. Note that the URL in urlTemplate is relative to the directory where the configuration file is located.
      {
         "label"         : "rnaseq",
         "key"           : "RNA-Seq Coverage",
         "storeClass"    : "JBrowse/Store/SeqFeature/BigWig",
         "urlTemplate"   : "../tests/data/SL2.40_all_rna_seq.v1.bigwig",
         "type"          : "JBrowse/View/Track/Wiggle/XYPlot",
         "variance_band" : true,
         "min_score"     : -1000,
         "max_score"     : 2000,
         "style": {
             "pos_color"         : "#FFA600",
             "neg_color"         : "#005EFF",
             "clip_marker_color" : "red",
             "height"            : 100
         }
      }
Note: numerical values do not appear in quotes.
Here is an example track configuration stanza for a Wiggle color-density track displaying data directly from a BigWig file. It will draw regions with data that is greater than the overall mean as progressively more intense blue, and data that is below the mean as progressively more intense red. Note that the URL in urlTemplate is relative to the directory where the configuration file is located.
  {
     "label"         : "rnaseq",
     "key"           : "RNA-Seq Coverage",
     "storeClass"    : "JBrowse/Store/SeqFeature/BigWig",
     "urlTemplate"   : "my_methylation_data.bw",
     "type"          : "JBrowse/View/Track/Wiggle/Density",
     "bicolor_pivot" : "mean",
     "style": {
         "pos_color": "purple",
         "neg_color": "green"
     }
  }
| Option | Value |
|---|---|
yScalePosition |
Position of the y-axis scale indicator when the track is zoomed far enough out that density histograms are displayed. Can be "left", "right", or "center". Defaults to "center". |
origin_color |
Added in JBrowse 1.7.1, sets the color of the graph origin line in wiggle XY plots. If set to 'none', turns the origin line off. |
bg_color |
Added in JBrowse 1.7.0, sets the background color for each point at which data is present. Wiggle/Density tracks blend the background color with the pos_color or neg_color to select a color for the region, whereas Wiggle/XYPlot tracks draw the background color on the part of the graph for each data point that is not covered by the pos_color or neg_color. Defaults to transparent for XYPlots, and light gray for Density tracks. |
scale |
linear,log default linear Graphing scale, either linear or logarithmic. |
min_score |
Number. The minimum value to be graphed. Calculated according to autoscale if not provided. |
max_score |
Number. The maximum value to be graphed. Calculated according to autoscale if not provided. |
autoscale |
local,clipped_global,global,z_score If one or more of min_score and max_score options are absent, then these values will be calculated automatically. The autoscale option controls how the calculation is done. A value of local (only available and set as the default in JBrowse 1.9.0 and above) sets the display scale to fit the range of the data being displayed in the current viewing window. A value of global will use global statistics (if available) for the entire quantitative dataset to find min_score and max_score values. z_score will use either ±z_score_bound if it is set, or will use ±4 otherwise. clipped_global is similar to global, except the bounds will be limited to ±z_score_bound, or ±4 if z_score_bound is not set. |
variance_band |
1 or 0 If 1, draw a yellow line showing the mean, and two shaded bands showing ±1 and ±2 standard deviations from the mean. |
z_score_bound |
for z-score based graphs, the bounds to use. |
data_offset |
number, default zero. If set, will offset the data display by the given value. For example, a data_offset of -100 would make a data value of 123 be displayed as 23, and a data_offset of 100 would make 123 be displayed as 223. |
bicolor_pivot |
mean,zero,or <number> representing the axis Where to change from pos_color to neg_color when drawing bicolor plots. Can be "mean", "zero", or a numeric value. Default 0. |
style→pos_color |
CSS color, default "blue". When drawing bicolor plots, the fill color to use for values that are above the pivot point. Can be a callback returning a color as well. |
style→neg_color |
CSS color, default "red". When drawing bicolor plots, the fill color to use for values that are below the pivot point. Can be a callback returning a color as well. |
disable_clip_markers |
boolean, default false. If true, disables clip markers, which are 2-pixel colored regions at the edge of the graph that indicate when the data value lies outside the displayed range. |
style→clip_marker_color |
CSS color, defaults to neg_color when in the positive bicolor regime (see bicolor_pivot) and pos_color in the negative bicolor regime. |
style→height |
Height, in pixels, of the track. Defaults to 100 for XYPlot tracks, and 32 for Density tracks. |
scoreType |
The scoreType to be used at the summary level. Options: maxScore, avgScore, score, minScore. Default: score is the backwards compatible default which is an average score when zoomed out, max score when zoomed in. maxScore is max score zoomed out and max score zoomed in. avgScore is both average score zoomed in and average score zoomed out. avgScore added in 1.12.0. maxScore/minScore added in 1.11.6. |
logScaleOption |
Add or remove the "Log scale" checkbox for the track menu. Default: true. Added in 1.11.6. |
noFill |
Draw the bigwig track as a "scatterplot" by not filling in the boxes. Default: false. Added in 1.12.3 |
fixBounds |
Rounds the min and max values that are more friendly for the tick marks on the ruler. Default, 'major'. Can also be 'none', 'micro', 'minor', and 'major'. Added in 1.16.2 |
At least one user has reported that BigWig files generated with older versions of Jim Kent's wigToBigWig tool are not compatible with JBrowse. If you encounter difficulties opening a BigWig file, try regenerating it with a more recent version of wigToBigWig, and reporting the problem to the mailing list.