After the coronavirus outbreak (COVID-19) governments, companies and organizations around the world are working to help prevent and alleviate the effects of coronavirus and also face its consequences.
Unfortunately, this virus has had an impact in very varied areas. This repository collects information to assess the economic impact of the Covid-19 in the stock market in more than 1850 companies in 50 different countries around the world.
To do that, this repository includes the script to produce a dataset of more than 2.5 million rows with the stock market data of each company that dates back 400 days, which will allow to clearly see the values before the outbreak and the impact during the pandemic.
This repository also includes a file produced by the Oxford Coronavirus Government Response Tracker (OxCGRT project) which contains information of each country with a Government Response Stringency Index which indicates the stringency regarding each government's response to reduce the impacts of covid-19 (https://ourworldindata.org/policy-responses-covid#government-stringency-index).
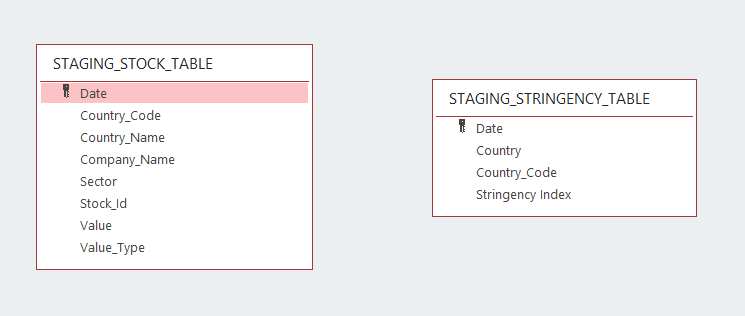
These two files correspond to the staging tables:
After cleaning and processing the data into analytics tables using Spark in a EMR cluster (through the ETL file) we will obtain the Data Lake desired in a S3 bucket.
This repository includes the files necessary to:
- Generate a huge dataset with stock market values of each company using yfinance library (https://github.com/ranaroussi/yfinance).
- Build an ETL pipeline for a Data Lake hosted on S3 and a database with a star schema model.
- Do quality checks on the Data Lake to ensure it has the right data and structure.
- An example as a presentation of how this data can be used to analyze the economic impact related to the stringency of each government.
The reason to use a Data Lake for this model is due to its simple implementation in S3 with a flexible storage system that allow our program to function properly regardless the data processed and uploaded. The reason for an EMR cluster with Spark is its capability to run big data frameworks and its integrity to process and analyze big amounts of data.
The datasets used for this project are:
- Stock_Countries.csv: This file contains information of each company, including:
- Name
- Sector
- Ticker
- Country
- Covid_Stringency_Index: This file contains the Stringency Index of each country regarding the measures taken to fight covid-19.
With the previous files we will produce the staging tables
- Staging_stock_table.csv: To produce this file I've used a filed with information about each country that I've collected (Stock_Countries.csv) and through each company's Ticker I've extracted the stock market values using yfinance library (https://github.com/ranaroussi/yfinance).
- Staging_stringency_table.csv: This file comes from the original Covid_Stringency_Index expanding it date range to match the start of Staging_stock_table.
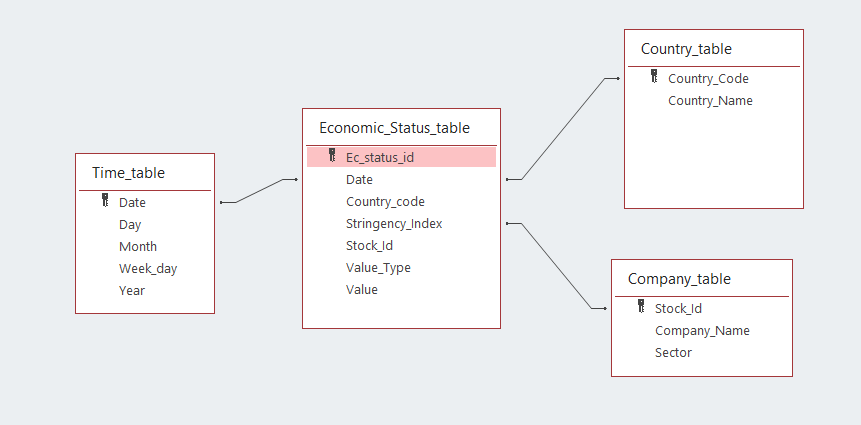
The tables of the star schema that is going to be created using this program are:
- Fact table:
- Economic_status_table [ec_status_id, Date, country_code, stringency_index, stock_id, value_type, value]
- Dimension tables:
- time_table [Date, day, month, year, week_day]
- Country_table [country_code, country_name]
- Company_table [stock_Id, company_name, sector]
- time [start_time, hour, day, week, month, year, weekday]
The final database with a star schema model will have the next structure:
The AWS infrastructure used was an EMR Cluster with the following settings:
Software configuration:
- Release: emr-5.31.0
- Applications: Spark: Spark 2.4.6 on Hadoop 2.10.0 YARN and Zeppelin 0.8.2 Hardware configuration:
- Instance type: m5.xlarge
- Number of instances: 3 Using an EC2 key pair for security and access.
For the Cleaning_Staging_Data notebook to work it is necessary to install the library yfinance.
For the Interface.py it is necessary to install Dash.
You can use:
pip install -r requirements.txt
This file contains the AWS credentials to access the S3 buckets. Here you will have to introduce your AWS key and secret access key:
[AWS]
AWS_ACCESS_KEY_ID= your AWS access key
AWS_SECRET_ACCESS_KEY= your AWS secret access key
This first script serves to explore the data and fix any quality issues and also to produce and load to an S3 bucket the staging tables that are mentioned above. Note: It is necessary to run this script before running Etl.py
With this file we will process all files from the S3 buckets and create the star schema (with all the tables mentioned above) and load them back into the S3 which will act as our Data Lake.
This file can be used to perform quality checks and it presents an example of how the data lake can be used to analyze the economic impact of covid-19.
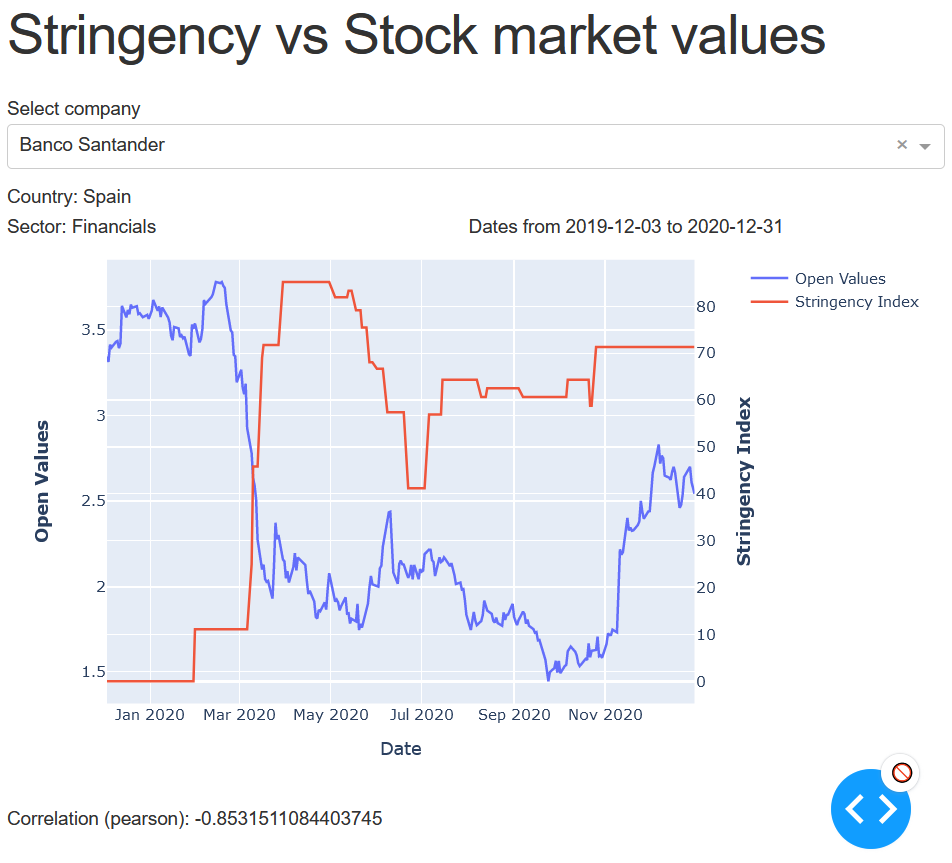
Once the Etl has run, we can deploy a web interface hosted on the master node of our EMR cluster and easily access to it using an Application Load Balancer (Here is the documentation to do so: https://aws.amazon.com/es/blogs/big-data/access-web-interfaces-securely-on-amazon-emr-launched-in-a-private-subnet-using-an-application-load-balancer/). The web interface (developed with Dash) will allow to see the stock market values of a company overlaid with the stringency values of the country the company is located.
Here is a screenshot of the Interface:
Note
Please bear in mind that the restrictions imposed by each country (measured by the Stringency Index value) may have or haven't influence the open values of a company stock. This interface calculates the relation between these two variables but the Stringency Index value should not be considered as the only or as the main responsible for the variation of the Stock market values. Instead, it should be considered as another factor that may represent other medical, social and economic conditions in each country, which may have affected (directly or indirectly) the stock prices of the Company displaying.
In addition, it is important to remember that the stock values of multinational companies such as Google (Alphabetic Inc.) are not only affected by the on-going restrictions in the country where it is headquartered but also, by restrictions in other countries where the company operates. If a multinational company is dual-listing its shares it can be useful to select the ticker for a specific exchange, e.g. Selecting SAN.MC (Madrid Stock Exchange) to assess the economic impact of Spanish restrictions on the Santander Bank stock prices.
This file provides the description of the program and process of the etl.
Because the data lake is subject to possible modifications, I'm going to suggest some solutions:
- The data increases by 100X: For this scenario, the right approach would be to increase the number of instances of the EMR cluster and maybe upgrade the Instance type to a r4.xlarge to take advantage of the increased memory.
- Pipelines run on daily basis at 7am: In this case it would be recommended to incorporated Airflow to create a Dag with a schedule that would run the Cleaning_Staging_Data to obtain the most recent values of the stock market values of the companies in our Stock_Countries.csv file and the ETL to update the data lake.
- The database is needed to be accessed by 100+ people: Thanks to the S3 our data lake would be accessible to the extra 100 people but if necessary, we could implement it to use Redshift with auto-scaling instead for a better approach.
Udacity provided the guidelines to start this project. The entirety of the project was developed by Guillermo Garcia and the review of the code and the verification that the project followed the proper procedures was made by my mentor from udacity.