High CPU usage on Mac OS X #531
Comments
|
Also seeing this behavior on 10.11.6. I've been having issues with running out of file descriptors in other apps, though I'm not sure if that's relevant to what's going on here or not... |
|
I have seen it also on linux (Linux turtle 4.16.7-1-ARCH #1 SMP PREEMPT Wed May 2 21:12:36 UTC 2018 x86_64 GNU/Linux) |
|
Ref #549 |
|
I've instrumented my local build of skaffold and found that this line: skaffold/pkg/skaffold/kubernetes/log.go Line 74 in 762c3ad Seems to suddenly return a nil/empty Event repeatedly. I have been able to trigger it by switching from one internet connection to another. I think the watch channel is closed and we're stuck in an infinite loop because of it. I'm not certain this is the source of the problem, but I'm experimenting locally with: case evt, ok := <-watcher.ResultChan():
if !ok {
// Try reopening
logrus.Infof("Log aggregator watch has stopped, respawning it.")
a.Start(ctx, client)
break
} |
|
I've been running this for a few days now and while the CPU usage issue is gone, I've seen the I guess there's something that goes bad elsewhere in the log watching state machine and just respawning it again is not sufficient. This change is better than nothing as it gives a landmark in the logs to launch deeper investigations from. Anyone have ideas about what might be going on? |
|
We have an mtime watcher now that should be better. |
|
@dlorenc can you elaborate please? I looked at the linked PR but there is not much detail on it. Does the mtime watcher basically poll large directories for modification of files? I'm experiencing this issue when switching between my home network and my office network. If the mtime solution using polling this will probably be bad for my use case since I'm using nodejs and the node_modules tree can be extremely large (gigabytes of deep directory structure). Very curious about the underlying cause of the inotify/fsevents solution. I've used those tools a lot on other projects and switched networks without issues, as I routinely work from home and from the office on the same laptop. |
|
Is the mtime watcher the default on 0.7.0, or did it miss the cut? If it's the default then I think I'm hitting the 100% CPU usage with the mtime watcher after suspending the laptop for > 1 hour while |
|
I see this issue while using a custom file watching system I wrote that's
completely independent of mtime and kevent.
My current suspect is the log tailing logic...
…On Sun, Jun 17, 2018, 18:36 Chris Corbyn ***@***.***> wrote:
Is the mtime watcher the default on 0.7.0, or did it miss the cut? If it's
the default then I think I'm hitting the 100% CPU usage with the mtime
watcher after suspending the laptop for > 1 hour while skaffold dev is
running.
—
You are receiving this because you are subscribed to this thread.
Reply to this email directly, view it on GitHub
<#531 (comment)>,
or mute the thread
<https://github.com/notifications/unsubscribe-auth/AAAcndJjsp6ut2tqELmOqo7q8uwF5mZIks5t9wQWgaJpZM4T3BQC>
.
|
|
Oh yeah, I've had the 100% CPU issue using |
|
I seem to have run into the 100% CPU usage again after around 45 minutes of inactivity. |
|
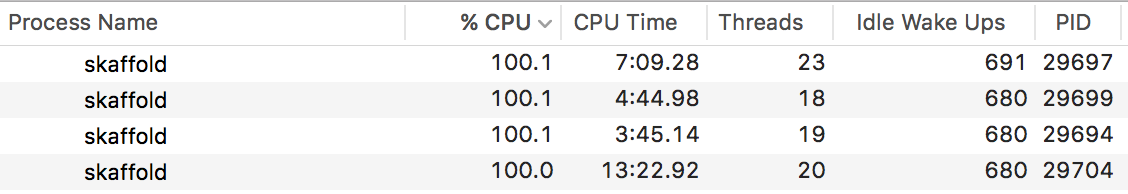
Interestingly I'm running multiple skaffold processes (microservices architecture) and they all collectively started using 100% CPU at the same time. So something environmental causes it to start happening. |
|
Can we re-open this issue?
|
|
Thanks @r2d4 - I'll see if I can pinpoint where the issue is. |
|
I've done some rudimentary debugging ( It seems to start thrashing there and receives events seemingly in a tight loop. This matches up with what @ajbouh observed too. |
Example code that uses Watcher correctly: https://github.com/kubernetes/kubernetes/blob/master/staging/src/k8s.io/client-go/tools/cache/reflector.go#L358 |
|
This probably matches what I see. Every time this issue starts happening for me, it's when log output from the containers has been idle for a while (e.g. when I go for lunch). |
Resolves: GoogleContainerTools#531
See also: kubernetes/client-go#12

There is an issue in which the Pods watcher gets into a infinite tight
loop and begins consuming 100% of the CPU. This happens after skaffold
dev has been running for a while (~30 mins) and once it starts, it
doesn't stop.

The issue was narrowed down by @ajbouh to the event polling loop in
`logs.go`, which was not checking if the `ResultChan()` is closed or not.
Kubernetes actually closes the connection after a timeout (default is in
the range of 30-60 mins according to the related issue linked to above).
In this case, the intended solution is to start the watcher again.

This refactors the polling into two nested loops. One to start (and
restart) the Pods watcher itself and another to receive and process the
events from the watcher. If the `ResultChan()` is closed, the entire
watcher loop is restarted and log tailing continues.

There is a subtle difference in error handling as a result of this
change. Previously any error returned from `client.Pods("").Watch()`
would be immediately returned from the `Watch()` func in `logs.go`. This
is no longer possible since the watcher is initialized in the goroutine
started by that func. As such, in the case the watcher cannot be
initialized, we simply log the error and stop tailing logs. Open to
suggestions as to be a better way to handle this error. Retrying in a
tight loop seems potentially problematic in the error scenario.
|
Posted a fix here: #704 |
Resolves: GoogleContainerTools#531
See also: kubernetes/client-go#12

There is an issue in which the Pods watcher gets into a infinite tight
loop and begins consuming 100% of the CPU. This happens after skaffold
dev has been running for a while (~30 mins) and once it starts, it
doesn't stop.

The issue was narrowed down by @ajbouh to the event polling loop in
`logs.go`, which was not checking if the `ResultChan()` is closed or not.
Kubernetes actually closes the connection after a timeout (default is in
the range of 30-60 mins according to the related issue linked to above).
In this case, the intended solution is to start the watcher again.

This refactors the polling into two nested loops. One to start (and
restart) the Pods watcher itself and another to receive and process the
events from the watcher. If the `ResultChan()` is closed, the entire
watcher loop is restarted and log tailing continues.

There is a subtle difference in error handling as a result of this
change. Previously any error returned from `client.Pods("").Watch()`
would be immediately returned from the `Watch()` func in `logs.go`. This
is no longer possible since the watcher is initialized in the goroutine
started by that func. As such, in the case the watcher cannot be
initialized, we simply log the error and stop tailing logs. Open to
suggestions as to be a better way to handle this error. Retrying in a
tight loop seems potentially problematic in the error scenario.
|
I think we may need to reopen this. I am observing this with low activity, also with
The full command is: |

|
Can anyone reopen this issue or point to a more recent one? In the 2018 Macs the fans are at full speed when leaving |
|
@davidfernandezm wow, that's quite high. have you tried running with a different watcher? |
|
Thanks a lot for your response @nkubala. There's one folder being watched that has around 5000 files, it's my suspicion that's the culprit. I will try the polling trigger to see if that has any effect. This is how my and on JIB side: |
|
@nkubala thanks a lot for your suggestion, it fixed the CPU issue... now it's like standing at 20% (has been running for 3h). Still want to confirm, but could you point to some doc or explanation of the differences between Thanks a lot again! |
|
@davidfernandezm glad to hear that fixed your issue! we have some brief documentation on the trigger types at https://skaffold.dev/docs/workflows/dev/ under "File Watcher and Watch Modes", but this could definitely be improved. I don't have time to do this right now but if you'd like to become a contributor feel free and throw some improvements together :) FYI it's not |
|
I'd love to become a contributor, but I am still learning Go basics. I am actually reading the code and learning a lot. Congrats on such great product to speed up K8s and cloud adoption in dev environments. |
|
Thanks @davidfernandezm! |
|
I don't know if this is the right place for this, but this is related to File Sync of thousands of files, which won't work at the moment. A block like this: in our scenario is trying to sync 4000+ files and getting: key part: Is there any workaround for when such number of files need to be deleted/synced? |
|
@davidfernandezm interesting....never seen that one before haha. would you mind opening a new issue to track that? |
Actual behavior
skaffold process generates about 100% sustained cpu usage when it is started with "skaffold dev" command. The project itself is quite small (4 deployments of third-party services and 1 locally built docker image), and the high cpu usage is present even without any local file changes.
VBoxHeadless process also has a sustained 150-200% CPU usage in Activity Monitor.
Information
The text was updated successfully, but these errors were encountered: