This is a program I wrote from scratch to estimate the average win rate percentages for dice-rolling battles in the board game Risk, via Monte Carlo methods.
Below, I have used Excel to help visualize the results that I found. These results are approximate and were each built using about 1500 "battles."
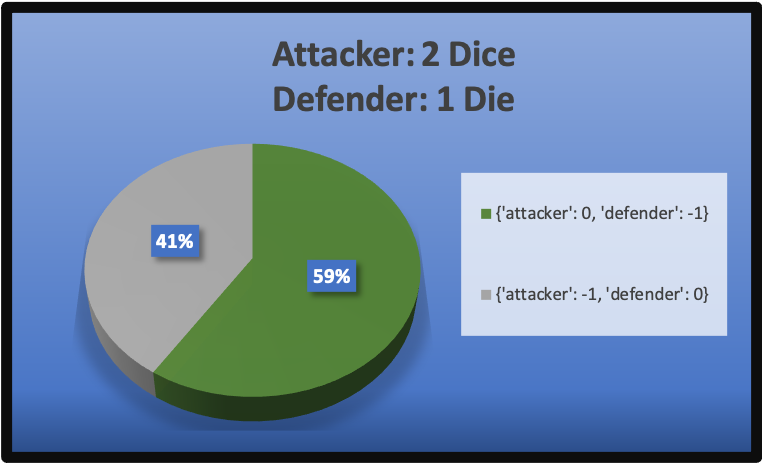
To understand these pie charts better, and what they represent, I'll explain how a typical dice-rolling battle would go in Risk: The number of dice that a player is allowed to roll is based on how many troops they have on the board piece that an attacker is trying to capture. The attacker can roll at most three dice (representing three attacking troops) as long as there would still be one troop left over if they were to lose all three troops in the battle. A defender can roll at most two dice (again, just representing two defending troops) even if they only have two troops left. The attacker could choose to roll less than three dice if they wish, to limit the risk of losing too many troops, but the defender will have to roll two dice as long as they have two troops with which to defend.
Determining a winner of the battle is up to the set of rolled numbers for each player. In all battles, all dice are rolled simultaneously, but then are paired up (one attacking die to one defending die) in order of decreasing magnitude. The attacking die in a pair will win if the number rolled is strictly greater than the magnitude of the defender's die with which it was paired.
Since there can be an uneven number of dice rolled in a battle, the lowest die will get thrown out from the player who rolled it's set of possible dice. This allows for higher-number dice to be favored.
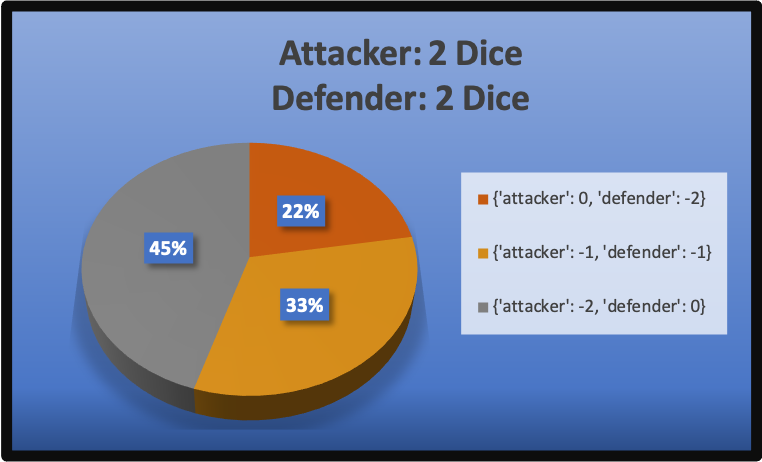
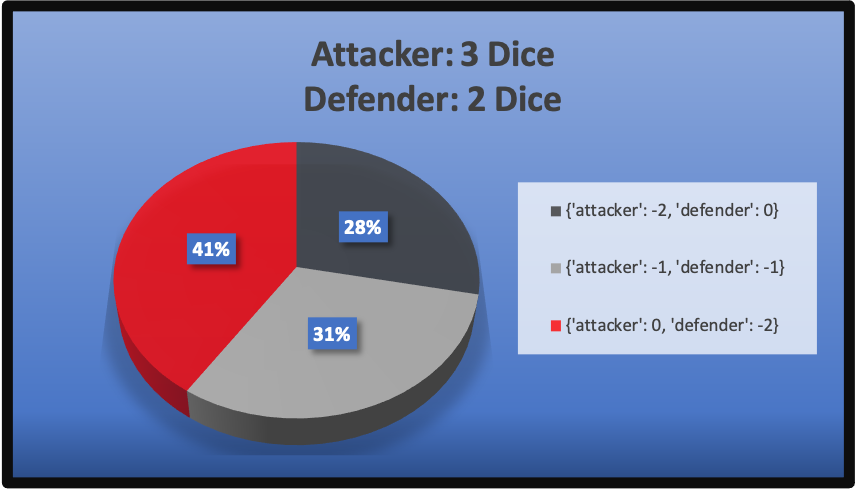
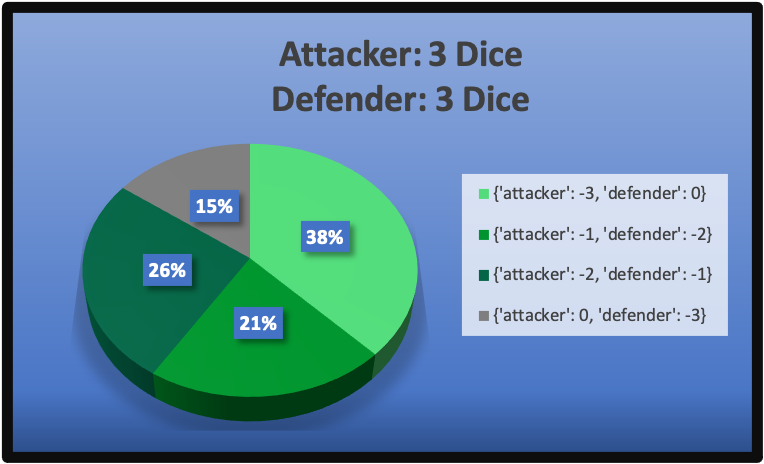
To interpret the results below, I labled each section of each pie chart with the corresponding outcome of the battle. For example,
{'attacker': -2, 'defender': 0}would correspond to a result where the attacker lost two troops and the defender lost zero. No battle will ever reward troops.