Python (numpy/scipy/pandas/matplotlib) based Visualization tool for population structure data as generated with Illumina SNP chips.
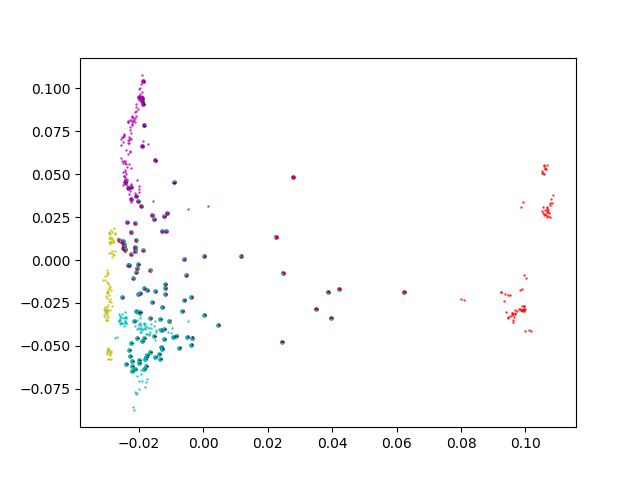
Various versions to plot PCA (as calculated by plink --pca) together with ADMIXTURE information: every point is a piechart. plotPCA3 also contains a (repeated) subsampling procedure, as well as exclusion of populations that are less relevant.
Dependencies:
- plink output files
- pandas
- matplotlib
- python 3

The Python scripts are supposed to be used as examplary.