requirements:
- Having GIT command installed on your computer
- Having a Python version >= 3.5
- Having a Gdal version >= 2.0
Definition :
A calulation Module (CM) is a plugin for hotmaps toolbox which is able to extend toolbox functionality.
How to connect a CM into the Hotmaps toolbox?
*Registration and hearthbeat:

_______________________________
│                    │        │      1. Once in the network, CM won't stop trying to register until it get a response from the HTAPI.
│         HTAPI      │ CM DB  │      2. Once registered HTAPI will request the CM in order to know if it's still alive or not.
│                    │        │      3. While alive a CM can be computed from the frontend using the interface GUI it describe on its SIGNATURE.
│____________________│________│
                        │    │
                        │    │
                        │    │    _________
                        │    └── │   CM2  │
                        │        │________│
                        │  __________
                        └─│  CM1    │
                          │________ │
The CM can run on its own, but when it is on the same network as the Hotmaps toolbox API (HTAPI), it will be automatically detected. Using Celery queue to register, HTAPI contains heartbeat that will Check at anytime if a calculation is running or not. That means the achitecture for CMs is working in realtime
Calculation module regitration
the HTAPI will retrieve the CM SIGNATURE and modify the frontend to allow the user to use the CM and modify the user interface with the inputs it needs to be ran.
Retrieving the calculation module base for my CM from git:
Find bellow the architecture of the CMs. All the CMs inherit from the base calculation module (cm base)
*GIT Repository architecture*:

___________
│ CM base │ upstream
│_________│
  │
  │
  │   __________
  └── │   CM1  │ origin
  │   │________│
  │
  │
  │   __________
  └── │   CM2  │ origin
      │________│
-
Create a repository on github named name_of_my_module, create a folder on your computer named it "name_of_my_module", go inside your new folder create. Please let the repository of your new module empty until you retrived the base_calculation_module code.
-
Using git command on your terminal be ready to code:
git init
git remote add origin https://github.com/HotMaps/name_of_my_module.git # add a remote link to my repository
git remote add upstream https://github.com/HotMaps/base_calculation_module.git # add a remote link to the base calculation module (BCM)# .
git pull upstream master
git add .
git commit -m "first commit" #update changes
git push -u origin master # push the changes (minimum code for run) .
- Start coding, switch branch from master to develop
git checkout -b develop- After coding
git add .
git commit -m "message to describe the changes"
git push origin develop
- Updating code with the base calculation module (BCM) code
git pull upstream master
If you encounter any issue like GIT conflict please contact CREM.
- Release a version of my CM
After testing your calculation module you can update the release branch(master branch)
git fetch && git checkout master # retrieved master branch
git merge develop # update the changes from develop to master
git push origin master # push changes on master branch
now tag your version then take a snapshot on your current version
git fetch && git checkout master # retrieved master branch
git merge develop # update the changes from develop to master
git push origin master # push changes on master branchcm/
├── app/
│ ├── api_v1/
│ │ ├── __init__.py
│ │ ├── calculation_module.py
│ │ ├── errors.py
│ │ └── transactions.py
│ │
│ │
│ │── decorators/
│ │ ├── __init__.py
│ │ ├── caching.py
│ │ ├── json.py
│ │ ├── paginate.py
│ │ └──rate_limit.py
│ │
│ │
│ ├── __init__.py
│ │── constant.py
│ │── logging.conf
│ │── utils.py
│ │
│ │
│ │── config/
│ │ ├── __init__.py
│ │ ├── development.py
│ │ ├── production.py
│ │ └── transactions.py
│ │
│ │── tests/
│ │ ├── __init__.py
│ │ ├── test_client.py
│ │ └── test.py
│ ├── __init__.py
│ ├── aync_consumer.py
│ ├── Dockerfile.py
│ ├── gunicorn-config.py
│ ├── requirements.txt
│ ├── run.py
│ ├── run_cm_services.sh
│ └── test.py
│
├── .gitiginore
├── docker-compose-der.yml
├── LICENCE
└── README.md
*the place of the main function for the calculation module *
app/requirements.txt- The list of Python framework (PyPi) requirements.app/api_v1/calculation_module.py- this is the place where the function for the CM belongsapp/api_v1/transactions.pycontains all the requests that allows to interacted with the CMapp/constant.pycontains the constants of the applications the most important constant is the SIGNATURE
INPUTS CALCULATION MODULE FIELD
In this section it's explain how to handle the differents kind of inputs
SIGNATURE INPUTS :
Signature describes the calculation module needed parameters and how to use it. This signature can be found in constants.py file. the SIGNATURE must be modified by the developer this signature can be divided into 2 parts, see bellow:
INPUTS_CALCULATION_MODULE=  [
    { 'input_name': 'Reduction factor',
      'input_type': 'input',
      'input_parameter_name': 'multiplication_factor',
      'input_value': 1,
      'input_unit': 'none',
      'input_min': 1,
      'input_max': 10
        , 'cm_id': CM_ID
      },
    { 'input_name': 'Blablabla',
      'input_type': 'range',
      'input_parameter_name': 'bla',
      'input_value': 50,
      'input_unit': '',
      'input_min': 10,
      'input_max': 1000,
      'cm_id': CM_ID
      }
]


SIGNATURE = {
    "category": "Buildings",
    "cm_name": CM_NAME,
    "layers_needed": [
        "heat_density_tot"
    ],
    "type_layer_needed": [
            "heat",
        ],
    "cm_url": "",
    "cm_description": "this computation module allows to divide the HDM",
    "cm_id": CM_ID,
    'inputs_calculation_module': INPUTS_CALCULATION_MODULE
}
SIGNATURE FIELDS
The signature contained some parameters that are needed by the main webservice HTAPI for the data exchange:
category:
This is the category of the calculation module
cm name:
This is the name of the calculation module that will be displayed on the frontend Graphical user interface(GUI)
layers needed:
Layers needed to run the calculation module
    "layers_needed": [
           "heat_density_tot",
           "cdd_curr_tif",
           "gfa_nonres_curr_density",
           "gfa_res_curr_density_lau"
       ],
When HTAPI will be compute a CM, it will send a python dictionnary named inputs_raster_selection in which there is a key the name of the layer for example heat_curr_density_tot and a value the name of the files generated by HATPI
by using this value CM can directly retrieve a clipped dataset
vectors needed:
Vectors needed to run the calculation module please find an example input vectors_needed:
    "vectors_needed": [
           "heating_technologies_eu28",

       ],
Now if you request "inputs_vector_selection['heating_technologies_eu28']" the output will be
{"heating_technologies_eu28": [{
                                "specific_investment_costs": "355",
                                "total_annual_net_efficiency": "0.93",
                                "price_index_households_appliances": "0.93",
                                "incost_cagr": "None",
                                "datetime": "01.01.2015 00:00",
                                "year": "2015",
                                "id": "10",
                                "labour_cost_index_construction_sector": "0.80",
                                "type_of_building": "existing SFH",
                                "fixed_o_and_m_unit": "EUR/kW",
                                "technical_lifetime": "20",
                                "k2_fixed_o_and_m": "-0.56",
                                "k2_specific_investment_costs": "-0.51",
                                "k1_fixed_o_and_m": "49",
                                "fixed_o_and_m": "13",
                                "equipment_cost_share_unit": "%",
                                "total_annual_net_efficiency_unit": "%",
                                "k1_specific_investment_costs": "1793",
                                "specific_investment_costs_unit": "EUR/kW",
                                "equipment_and_maintenance_index": "0.84",
                                "nuts0_id": "FR",
                                "fk_time_id": "179862",
                                "variable_o_and_m_unit": "EUR/kWh",
                                "country": "France",
                                "installation_cost_share": "0.30",
                                "installation_cost_share_unit": "%",
                                "variable_o_and_m": "None",
                                "technical_lifetime_unit": "years",
                                "fk_nuts_gid": "265",
                                "nuts_id": "FR",
                                "equipment_cost_share": "0.70",
                                "heating_equipment": "Oil boiler"
                              },
                              {
                                "specific_investment_costs": "76",
                                "total_annual_net_efficiency": "0.92",
                                "price_index_households_appliances": "0.93",
                                "incost_cagr": "None",
                                "datetime": "01.01.2015 00:00",
                                "year": "2015",
                                "id": "38",
                                "labour_cost_index_construction_sector": "0.80",
                                "type_of_building": "existing MFH",
                                "fixed_o_and_m_unit": "EUR/kW",
                                "technical_lifetime": "20",
                                "k2_fixed_o_and_m": "-0.56",
                                "k2_specific_investment_costs": "-0.51",
                                "k1_fixed_o_and_m": "49",
                                "fixed_o_and_m": "2",
                                "equipment_cost_share_unit": "%",
                                "total_annual_net_efficiency_unit": "%",
                                ...
When HTAPI will be compute a CM, it will send a python dictionnary named inputs_vector_selection in which there is a key the name of the vector requested for example heating_technologies_eu28 and an array of json dictionnary as a value the name of the files generated by HATPI
type layers needed:
this parameter(type_layer_needed) will need the type of information needed as input for instance for the gross_floor_area type the user can choose on the frontend GUI gfa_nonres_curr_density or gfa_res_curr_density #TODO: type_layer_needed will replace the layers_needed in the futur also it allows to handle symbologie here the type different input type
- heat,
- gross_floor_area,
- building_volume,
- solar_optimal_total (for the case of one layer in the project the type will be the name of the layer). layers type allows to handle custom layer from the user and the ablility to chose from multiple layer with the same type
example:
     clipped_heat =  inputs_raster_selection["heat"]
     clipped_gfa =  inputs_raster_selection["gross_floor_area"]
     clipped_solar_optimal_total=  inputs_raster_selection["gross_floor_area"]
cm description:
Description of purpose of the CM that will be displayed on the frontend GUI
cm id:
Unique identifier that is defined by the WP4 leader
authorized scale:
This parameter will disable all scales not declared in it. Please find bellow the different scales allowed:
- NUTS 0
- NUTS 1
- NUTS 2
- NUTS 3
- LAU 2
- Hectare
"authorized_scale":["NUTS 2","NUTS 0","Hectare"],
CALCULATION MODULE GRAPHIC USER INTERFACE INPUTS
The purpose of this part is giving the ability to the developer to build is own user interface. the JSON payload will be use to modify automatically the user interface. it's an array of inputs. see bellow what is an input object
Input name:
it is the name of the CM that will be displayed on the frontend (User interface)
Input type:
The input is the graphical control element that user need to access enter data. There are five possible inputs, see https://getuikit.com/docs/form for more information about the implementation of the frontend GUI
- input:

This is a textbox where the user can type a value.
- select:
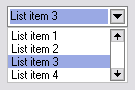
exemple:
 {
   'input_name': 'select your input',
   'input_type': 'select',
   'input_parameter_name':'item name' ,
   'input_value': ["List item 1",
                   "List item 2",
                   "List item 3",
                   "List item 4"],
   'input_unit': 'none',
   'input_min': 'none',
   'input_max': 'none', 'cm_id': CM_ID
    },
This is a drop down menu that allows the user to choose one value from a list.
-
radio :

It allows the user to choose only one of a predefined set of mutually exclusive options.
- checkbox

This graphical component allows the user to choose between one of two possible mutually exclusive options
- range
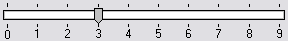
The range is graphical control element with which a user may set a value by moving an indicator.
Input Parameter Name:
It's the input parameter name the CM needs to retrieve for calculations
input value:
It's a default value for the input that will be displayed on the user interface
input min & max:
This is the range of the input value needed, this will prevent from mistake in the calculation
input priority
This parameter allows to categorize input in the user inteface. the value needed is an integer from 0-4
- 0 =>imput always visible
- 1 to 4 => the input is on a dropdown menu
             {'input_name': 'Reduction factor',
              'input_type': 'input',
              'input_parameter_name': 'multiplication_factor',
              'input_value': 1,
              'input_priority': 0,
              'input_unit': 'none',
              'input_min': 1,
              'input_max': 10, 'cm_id': CM_ID  # Do no change this value
              },
CALCULATION MODULE OUTPUTS:
The purpose of this part is to give developers the ability to build differents king of output(graphic,layers,indicators).
example:
            "result": {
                "indicators": [
                    {"unit": "MWh","name": "Heat demand indicator with a factor divide by 2","value": 281244.5},
                    {"unit": "MWh","name": "Heat demand indicator with a factor divide by 3","value": 187496.3},
                    {"unit": "MWh","name": "Heat demand indicator with a factor divide by 4","value": 140622.25}
                ],
                "name": "test_calculation_module",
                "raster_layers":[
                             {"name": "heat density layer divide by 2","path": output_raster_path_tif_1,"type": "heat"},
                             {"name": "heat density layer divide by 3","path": output_raster_path_tif_2,"type": "heat"},
                             {"name": "gross floor area layer divide by 4","path": output_raster_path_tif_3,"type": "gross_floor_area"},

                             ],
                "vector_layers":[
                                  {"name": "heat density layer divide by 2","path": 'e6caa1dc-e3c0-4968-977a-197c8fe29d32.zip',"type": "heat"},
                                  {"name": "heat density layer divide by 3","path": 'e6caahkiuu-e3c0-4968-977a-197c8fe29d32.zip',"type": "heat"},
                                  {"name": "heat density layer divide by 4","path": 'e6caa1dc-e3c0-4968-977a-hhzthfefe.zip',"type": "heat"},
                                      ],

                "csv_files":[
                            {"name": "heat_load_1","path": output_csv_file_1},
                            {"name": "heat_load_2","path": output_csv_file_2},
                            {"name": "heat_load_1","path": output_csv_file_3},
                                ],
                 "graphics": [{
                         "type": "bar",
                         "data": {
                             "labels": ["Default dataset","FR569","DE562","AT130","FR125"],
                             "datasets": [
                                 {
                                     "label": "Calculation module chart",
                                     "backgroundColor": [ "#3e95cd","#8e5ea2","#3cba9f","#e8c3b9","#c45850" ],
                                     "data": [2478,5267,734,784,433]
                                 }
                             ]
                         }
                     },{
                           "type": "bar",
                           "data": {
                               "labels": ["Default dataset","FR569","DE562","AT130","FR125"],
                               "datasets": [
                                   {
                                       "label": "Calculation module chart",
                                       "backgroundColor": [ "#3e95cd","#8e5ea2","#3cba9f","#e8c3b9","#c45850" ],
                                       "data": [2478,5267,734,784,433]
                                   }
                               ]
                           }
                           },]

}In transaction.py file The CM provider can modify the output in order to display as many indicator as he wants on the frontend this indicators will be displayed on the result panel of the frontend.
- indicators (Array): Array of indicators
- unit (string): Unit of the indicator
- name (string): Name of the indicator
- value (number): Value of the indicator
example:
            "result": {
                "indicators": [
                    {"unit": "MWh","name": "Heat demand indicator with a factor divide by 2","value": 281244.5},
                    {"unit": "MWh","name": "Heat demand indicator with a factor divide by 3","value": 187496.3},
                    {"unit": "MWh","name": "Heat demand indicator with a factor divide by 4","value": 140622.25}
                ],
                "name": "test_calculation_module"
}- raster_layers (Array): Array of raster layer
- name (string): Name to be displayed on the frontend
- path (string): path generated of the geotif file
- type (string): this is the type of layer generated
the path must be generated on the first lines of calculation() function found in calculation_module.py using the function generate_output_file_tif() which need the output directory as an argument exemple:
          output_raster_path_tif_1 = generate_output_file_tif(output_directory)
          output_raster_path_tif_2 = generate_output_file_tif(output_directory)
          output_raster_path_tif_3 = generate_output_file_tif(output_directory)
All the layers outputs must be retrieved and added on the raster_layers array after they have been created by the calculation module provider functions
            "raster_layers":[
                             {"name": "heat density layer divide by 2","path": output_raster_path_tif_1,"type": "heat"},
                             {"name": "heat density layer divide by 3","path": output_raster_path_tif_2,"type": "heat"},
                             {"name": "gross floor area layer divide by 4","path": output_raster_path_tif_3,"type": "gross_floor_area"},
if an unknown type of layer is generated(layer that is not of type heat,gross_floor_area, building_volume,solar_optimal_tota ) a new field must be created, the field "symbology" and the raster must be set on type "custom". the field symbology must contains the RGB colors, which are values between 0 - 255, the opacity which are values between 0 - 1, the value of range defined and the label of range defined
            "raster_layers":[
                             {"name": "district heating coherent areas","path": output_raster1, "type": "custom", "symbology": [{"red":250,"green":159,"blue":181,"opacity":0.8,"value":"1","label":"DH Areas"}]}]
- vector_layers (Array): Array of vector layer
- name (string): name to be displayed on the frontend
- path (string): path generated of the vector file
- type (string): this is the type of layer generated
The path must be generated on the first lines of calculation() function found in calculation_module.py using the function generate_output_file_shp() which need the output directory as an argument
exemple:
output_shp_1 = generate_output_file_shp(output_directory)Before to send back result to the HTAPI, the CM must generate a zip file, that will be handled by the HTAPI. To do so the CM provider must provide the following function and will write the output on the json array
output_shp_zipped_1 = create_zip_shapefiles(output_directory, output_shp_1)All the layers outputs must be retrieved and added on the vector_layers array after they have been created by the calculation module provider functions and compress with the function create_zip_shapefiles()
            "vector_layers":[
                              {"name": "wwtp_1","path": output_shp_zipped_1,"type": "wwtp"},
                              {"name": "wwtp_2","path": output_shp_zipped_2,"type": "wwtp"},
                              {"name": "hwwtp_3","path": output_shp_zipped_3,"type": "wwtp"},
                                  ],
- csv_files (Array): Array of csv layer
- name (string): Name to be displayed on the frontend
- path (string): path generated of the csv file
the path must be generated on the first lines of calculation() function found in calculation_module.py using the function generate_output_file_csv() which need the output directory as an argument exemple:
          output_csv_path_1 = generate_output_file_csv(output_directory)
          output_csv_path_2 = generate_output_file_csv(output_directory)
          output_csv_path_3 = generate_output_file_csv(output_directory)
All the csv outputs must be retrieved and added on the csv_files array after they have been created by the calculation module provider functions
            "csv_files":[
                             {"name": "csv 1","path": output_csv_path_1},
                             {"name": "csv 2","path": output_csv_path_2},
                             {"name": "csv 3","path": output_csv_path_3}],
In this part it's describes how to create graphics that will be displayed of the frontend
-
charts (Array): Array of chart
-
type (string) : this is the type of graphic that will be display Type of chart (possible values: 'bar', 'line', 'radar', 'pie', 'polarArea', 'bubble')
- line: A line chart or line graph is a type of chart which displays information as a series of data points called 'markers' connected by straight line segment
-
bar: A bar chart or bar graph is a chart or graph that presents categorical data with rectangular bars with heights or lengths proportional to the values that they represent.
-
radar: A radar chart is a way of showing multiple data points and the variation between them.
-
pie: A pie chart is divided into segments, the arc of each segment shows the proportional value of each piece of data..
-
polarArea: Polar area charts are similar to pie charts, but each segment has the same angle - the radius of the segment differs depending on the value..
-
-
xLabel: Define the text displayed on x-axis,
-
yLabel: Define the text displayed on y-axis (ex:Heat power(MW)),
-
data: Contains label and datasets
-
labels (string[]) : x axis labels
-
datasets (Array): set of data with there configuration
- label (string) : Serie's label
- backgroundColor (string[]) : Background color of each value to display
- data (number[]) : Each value for the serie
-


    "charts": [{
        "type": "bar",
         "xLabel": "Horizontal series label",
         "yLabel": "Vertical series label name",
        "data": {
            "labels": ["Default dataset","FR569","DE562","AT130","FR125"],
            "datasets": [
                {
                    "label": "Calculation module chart",
                    "backgroundColor": [ "#3e95cd","#8e5ea2","#3cba9f","#e8c3b9","#c45850" ],
                    "data": [2478,5267,734,784,433]
                }
            ]
        }
    },{
      "type": "bar",
      "data": {
          "labels": ["Default dataset","FR569","DE562","AT130","FR125"],
          "datasets": [
              {
                  "label": "Calculation module chart",
                  "backgroundColor": [ "#3e95cd","#8e5ea2","#3cba9f","#e8c3b9","#c45850" ],
                  "data": [2478,5267,734,784,433]
              }
          ]
              }
          },]
Retriving list of layers available for CM
please find in the link the list of layers available as input for a CM (ressource name column):
Calculation Module development GUIDELINES in local environement
1. Install requirements.
Install all the libraries needed to run the CM
cd cm
pip install -r requirements.txt
2. Run the CM API:
run the api in a terminal
cd cm
python run.py
the documentation can be check at http://0.0.0.0:5001/apidocs/)
3. Test my CM :
before writing writing any line of code test the existing one, run the test in a new terminal
cd cm
python test.py
4. Modify constant.py :
if the test is ran and ok the constants.py file must be changed in order to
- give a CM name
- build frontend user interface of the CM
- assign a unique CM_ID (please contact the research center of Martigny (CREM))
- modify the SIGNATURE
- etc
5. Write your code on calculation_module.py :
the calculation_module.py is a bridge between the CM function and the CM architecture all the new code must be added on the directory my_calculation_module_directory
Running my CM with docker:
In the root directory:
docker-compose up -d --buildRunning my CM in my computer(local environment):
cd cm
python run.py
Implementing my CM
-
modify the signature in constant.py to describe your CM
-
modify the input parameter name in transaction.py in the input of calculation() from calculation_module.py
-
add main function in calculation() functions (calculation_module.py )