Use IAR System's C-SPY Debugger to debug embedded programs using Visual Studio Code, with support for a wide range of embedded devices and debug probes. This extension can be used with IAR Embedded Workbench (.ewp) projects, or with other build systems such as CMake. An IAR Embedded Workbench installation using IDE version 8 or newer is required to use this extension. See Compatibility table below for detailed information.
To debug an IAR Embedded Workbench (.ewp) project, we recommend also installing the IAR Build extension.
The extension will then automatically provide debug configurations for your project.
If you do not have a launch.json file in the workspace,
simply press Run and Debug in the Debug view to start debugging the current project and configuration.
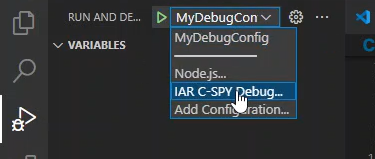
If you already have a launch.json file, automatic C-SPY debug configurations can be accessed by pressing IAR C-SPY Debug... in
the debug configuration dropdown.
To debug a program without an IAR Embedded Workbench project (e.g. from a CMake project) you need to manually provide a debug
configuration in the form of a launch.json file.
There are two ways to do this:
- Follow the instructions for generating a launch.json configuration
from an IAR Embedded Workbench project and copy the
launch.json file. - Create the configuration yourself. Please see the reference for the launch.json format.
For more help, see Debugging a stand-alone application.
Click here to view the full documentation.
This extension is compatible with selected IAR Embedded Workbench (EW) products. The following table decsribes the level of support for your specific product:
IAR EW - Compatibility table
| IAR EW version | Limitation |
|---|---|
| Arm v9.30 or later RISC-V 3.11.1 or later RL78 v5.10 or later AVR v8.10 or later RX v5.10 or later |
None |
| RISC-V v3.10 | Terminal I/O is not supported |
| Arm v8.50-9.20.4 RH850 v3.10 or later |
An initial debug session with EW is required prior to debugging in VSCode |
| Arm v8.40-8.50 | The variables view is not supported |
Note: You may experience crashes using multicore debugging with Arm 9.10.2 and earlier, as well as RH850 3.10.2 and earlier.
If you are unable to start a debug session in Visual Studio Code, please verify that debugging in IAR Embedded Workbench works (to rule out any non-Visual Studio Code related issues). Depending on the type of feedback you want to share with us, here are our preferred options:
-
For urgent matters with the extension, or if you have issues with the underlying IAR Embedded Workbench product, report this via the IAR Systems technical support channel at IAR Technical Support.
-
For other matters isolated to this extension, file a New issue using the provided template. We will reply on a "best effort basis".
-
If you have ideas on how to improve this extension, see CONTRIBUTING.md on how to proceed.