Home
Cognos Dancing Dashboard
Real-time streaming of Automotive device's data using Custom Widgets within Cognos Dashboard
"Get the code":
- Demo URL
This code pattern demonstrates to build a Cognos add-on to consume highly volatile streaming (real-time) data. From the traditional Cognos analytics (previous to 11.0.x version) dashboard, it was NOT possible to show the volatility and the non-volatile data in a single dashboard. Meaning, the real-time data display was not possible directly. Now, with the latest features of Cognos Analytics 11.x, custom widgets can be built to display volatile data and custom widgets can be used through Extensions in Cognos Dashboards. It shows a dancing chart, that captures volatile data and incrementally updates itself.
-
Analytics: Analytics delivers the value of data for the enterprise.
-
Business intelligence (BI) is a technology-driven process for analyzing data and presenting actionable information to help executives, managers and other corporate end users make informed business decisions.
This pattern demonstrates displaying live-insights of the devices health metrics from Cognos Dashboard. In the Automobile manufacturing Industry, one of the key challenging tasks is to monitor the devices and taking an accurate decision of bringing them for planned or un-planned maintenance. This code pattern makes the developer job easy as we are providing the code which can be forked, and with minor changes one can start using in their Cognos application. Use the java script code which is hosted on gitHub.
The dashboard displays both volatile and non-volatile data. Meaning, the static data is being read from the json spec (can also be read from any traditional database but for this pattern we restricted to read from json spec) and the real-time data is being read from the json spec through a random number generator (which can be read from IoT device data through REST APIs). This dashboard is primarily useful for Automobile Industry (or) a manufacturing unit's, where a plant engineer monitors the devices in real-time. For example, if any of these metrics (or) the combinations of the metrics (Pressure/Temperature/Vibration) go beyond the threshold points, then the plant engineer would take a call to bring devices down for maintenance.
In Automobile manufacturing unit, a plant engineer's job is to continuously monitor the devices health and keep them intact. It is quite a tedious job for him to monitor constantly those devices and take a call to bring the devices down for maintenance. When there is a corrective maintenance task, where equipment is repaired or replaced after wear, malfunction or break down, at that moment going for maintenance is a fair ask. But, if there is preventive/predictive maintenance required based on the previous break down activities, the system/models would have predicted for the device to bring down for maintenance. However, if you really look at the live (real-time) metrics of the devices, he would notice that devices health is absolutely fine and intact, and the plant engineer would not go to an unnecessary (overhead) maintenance. In order to see such live/real-time metrics from the Cognos dashboard, it is not a straight way to build. This code pattern helps us to achieve this functionality with the help of Custom widgets which is built using d3 and js(java scripts).

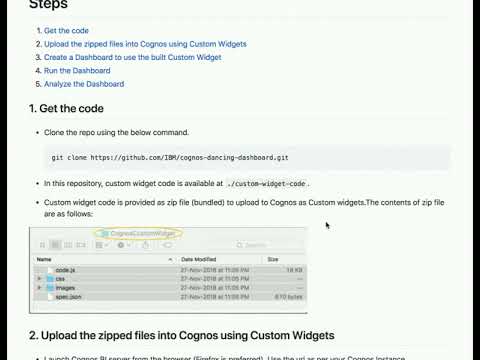
- Develop the code (includes spec.json, js, css, Images) to build Cognos Custom Widget (Extensions).
- Bundle the code as a zip file.
- Upload the zipped files into Cognos using Extensions.
- Use the built custom widget into Cognos Dashboard.
Find the detailed steps for this pattern in the readme file
The steps will show you how to:
- Get the code
- Upload the zipped files into Cognos using Custom Widgets
- Create a Dashboard to use the built Custom Widget
- Run the Dashboard
- Analyze the Dashboard
-
JavaScript - Develop forms to capture user inputs, later these forms can be imported to Cognos dashboards.
-
d3js - Develop charts like pie, bar, or some fancy charts sunburst etc which can later be imported to Cognos application.
-
Cognos Analytics - On-Prim version of Cognos 11.0.x or SaaS offering of Cognos 11.0.x.
- Cognos Analytics - On-Prim version of Cognos 11.0.x or SaaS offering of Cognos 11.0.x.
- N/A
Real-time streaming of Automotive device's data using Custom Widgets within Cognos Dashboard is quite useful for automobile (or) a manufacturing industry, where a plant engineer by looking at the live streaming dashboard can take instant decisions on whether to bring the devices down for maintenance yes/no based on the live metrics such as pressure/temperature/vibrations. With the latest release of Cognos analytics (11.0.x version) dashboard, it is possible to show the volatility and the non-volatile data in a single dashboard. Meaning, the real-time data display was not possible directly in the earlier version of Cognos. Now, with the latest features of Cognos Analytics 11.x, custom widgets can be built to display volatile data and custom widgets can be used through Extensions in Cognos Dashboards. It shows a dancing chart, that captures volatile data and incrementally updates itself.