Grafana Dashboard Panel shows no metric values for a particular entity
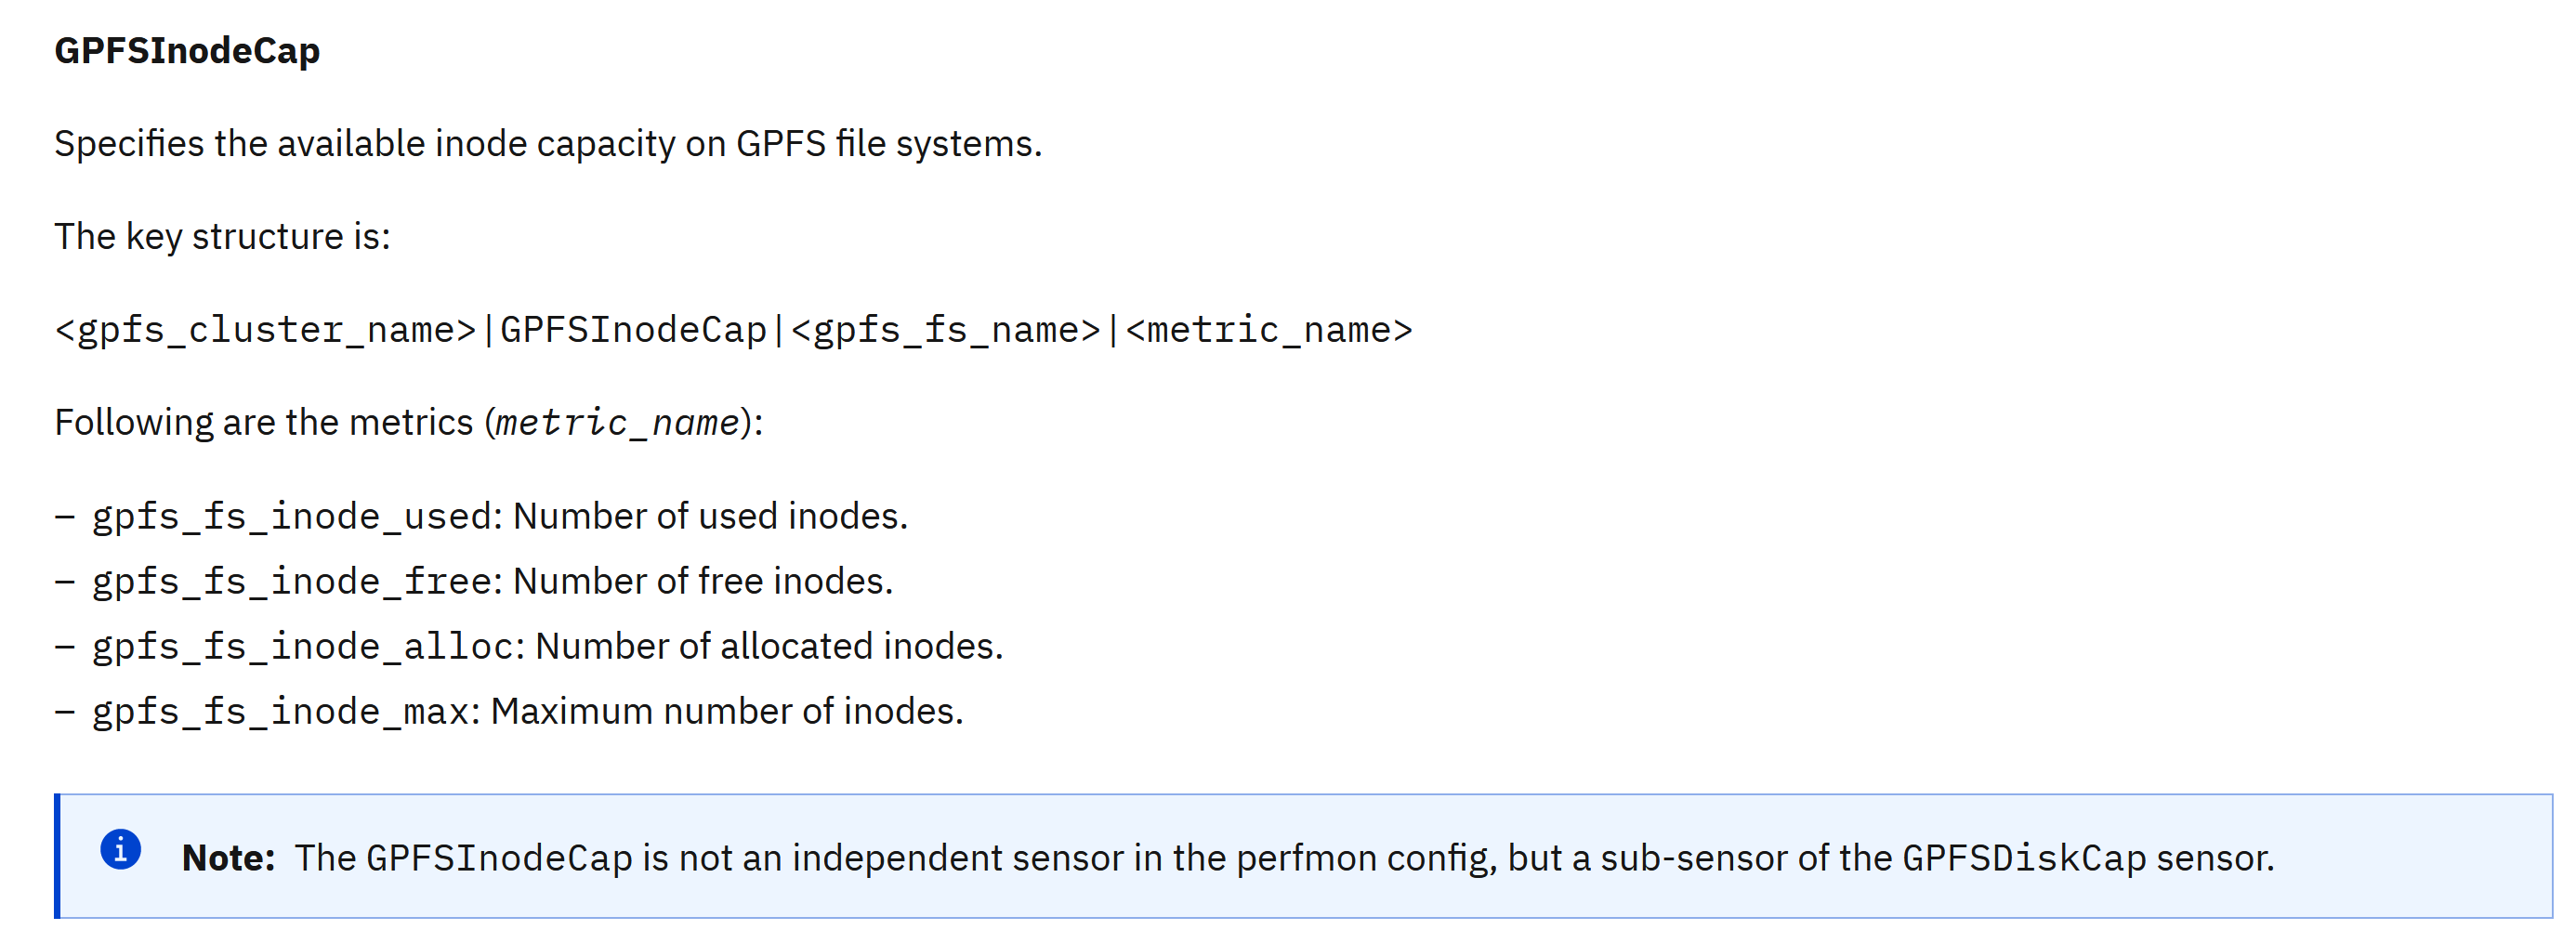
" I don't see any gpfs_fs_inode_used metric values for the filesystem localFS "

-
Verify the connection between your Grafana Server and the IBM Storage Scale bridge for Grafana data source is established successfully.

-
Verify that the metric name is listed under the IBM Storage Scale Performance Monitoring tool supported metrics. Notice the sensor name that provides the metric data.
-
Verify the metric sensor is configured and enabled on your GPFS cluster using the mmperfmon config show command.
Example output:
[root@scale-11 ~]# mmperfmon config show
  ...
sensors = {
	...

{
    name = "GPFSDiskCap"
    period = 86400
    restrict = "@CLUSTER_PERF_SENSOR"
},
	...
}
For more info please check the mmperfmon command reference
-
You can check if the metric returns any values without invoking the IBM Storage Scale bridge for Grafana, for example by using mmperfmon query command.
Example output:
[root@scale-11 ~]# mmperfmon query gpfs_fs_inode_used -b 86400 -n 2

Legend:
1:     scale-cluster-1.vmlocal|GPFSInodeCap|cesSharedRoot|gpfs_fs_inode_used
2:     scale-cluster-1.vmlocal|GPFSInodeCap|localFS|gpfs_fs_inode_used

Row           Timestamp gpfs_fs_inode_used gpfs_fs_inode_used
1 2022-12-07-01:00:00               null               null
2 2022-12-08-01:00:00               4077               null
From the output data above, it appears that the Performance monitoring tool(zimon) itself does not return any gpfs_fs_inode_used values for the localFS filesystem. Since the GPFSInodeCap sensor measures the values every 86400 seconds(1x24h), it could happen that the values for the freshly created file systems only appear after the next measure timepoint.
-
If the problem persists after 24 hours, contact IBM Storage Scale Support for further problem investigation.