Figure number: Figure 3.7 From the IPCC Working Group I Contribution to the Sixth Assessment Report: Chapter 3
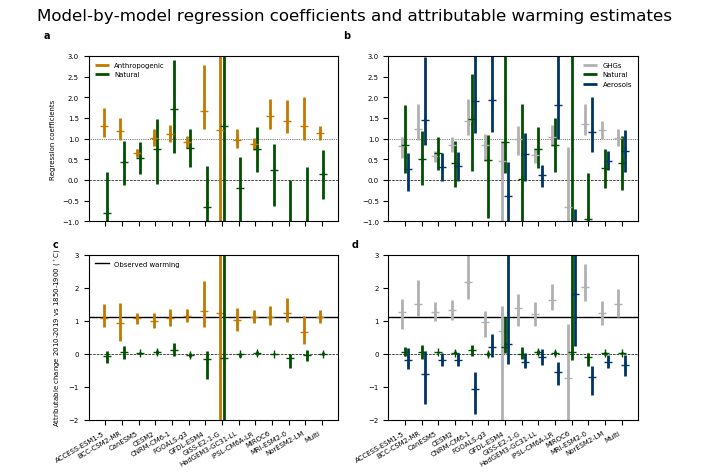
Regression coefficients and corresponding attributable warming estimates for individual CMIP6 models. Upper panels show regression coefficients based on a two-way regression (left) and three-way regression (right), of observed 5-yr mean global mean masked and blended surface temperature (HadCRUT4) onto individual model response patterns, and a multi-model mean, labelled ‘Multi’. Anthropogenic, natural, greenhouse gas, and other anthropogenic (aerosols, ozone, land-use change) regression coefficients are shown. Regression coefficients are the scaling factors by which the model responses must be multiplied to best match observations. Regression coefficients consistent with one indicate a consistent magnitude response in observations and models, and regression coefficients inconsistent with zero indicate a detectable response to the forcing concerned. Lower panels show corresponding observationally-constrained estimates of attributable warming in globally-complete GSAT for the period 2010-2019, relative to 1850-1900, and the horizontal black line shows an estimate of observed warming in GSAT for this period. Figure is adapted from Gillett et al. (2021), their Extended Data Figure 3.
- Gillett, N: ECCC, Canada, nathan.gillett@canada.ca, npgillett
- Kirchmeier-Young, M: ECCC, Canada
- Cowtan, K: University of York, UK
- Constraining human contributions to observed warming since the pre-industrial period, Gillett N. et al, Nat. Clim. Chang. 11, 207–212, DOI: 10.1038/s41558-020-00965-9, 2021.
- ESMValTool-AR6-OriginalCode-FinalFigures: ar6_chapter_3_nathan
Recipe used: recipes/recipe_gsat_attribute.yml
Diagnostic used: diag_scripts/ipcc_ar6/attrib_blended.py
This is the path of the image relative to the automatically generated ESMValTool output location:
- recipe_gsat_attribute_YYYYMMDD_HHMMSS/plots/gillett20_figs/fig3_7/reg_attrib_gmst05_GHG_had4.png
- recipe_gsat_attribute_YYYYMMDD_HHMMSS/plots/gillett20_figs/fig3_7/reg_attrib_gmst05_GHG_had4.pdf
N/A
In addition to the main figure, diagnostics may produce several figures and datasets along the way or several versions of the main figure. Please use this space to highlight anything that may be useful for future iterations:
HadCRUT4 files should be located in esmvaltool auxiliary directory: HadCRUT.4.6.0.0.median.nc and HadCRUT.4.6.0.0.anomalies.*.nc (1-100) should be downloaded from https://www.metoffice.gov.uk/hadobs/hadcrut4/data/current/download.html
Another non-esmvaltool preprocessed dataset is CNRM-CM6-1-5x5-sftlf.nc, a CNRM-CM6-1 sftlf file regridded with cdo onto 5*5 degrees greed.
- ESMValTool environment file: IPCC_environments/esmvaltool_ar6_attribution_conda_environment.yml
- pip file: IPCC_environments/esmvaltool_ar6_attribution_pip_environment.txt
- Other software used: cdo==1.5.3
Internal ECCC-CCCma machine lxwrk3.
** The documentation was created by Chapter 3 Chapter Scientist Elizaveta Malinina (email: elizaveta.malinina-rieger@canada.ca, githubid: malininae). Please, contact Elizaveta in case any questions in documentation arise.