The project is to prepare all standardized test data analysis, reporting, and presentation to provide insights about performance trends and patterns. These insights are used to inform discussions and strategic decisions at the school and district level. A new_full_student_data.csv file is being provided that includes student ID, student name, grade, school name, reading score, math score, school type (charter/public) and school budget. In order to be in sync with the working team a python development environment needs to be created and used throughout the project work.
The purpose of this project is to prepare and analyze the new dataset file (new_full_student_data.csv) to provide insight and presentation to school district management. Analyzing performance trends and patterns for math and reading scores will require creating summaries and drill-downs of the data provided. This will require using Jupyter Notebook and Pandas in a Python environment and creating a dataframe, reading the dataset .csv, cleaning the data, using location functions, aggregations and summary statistics.
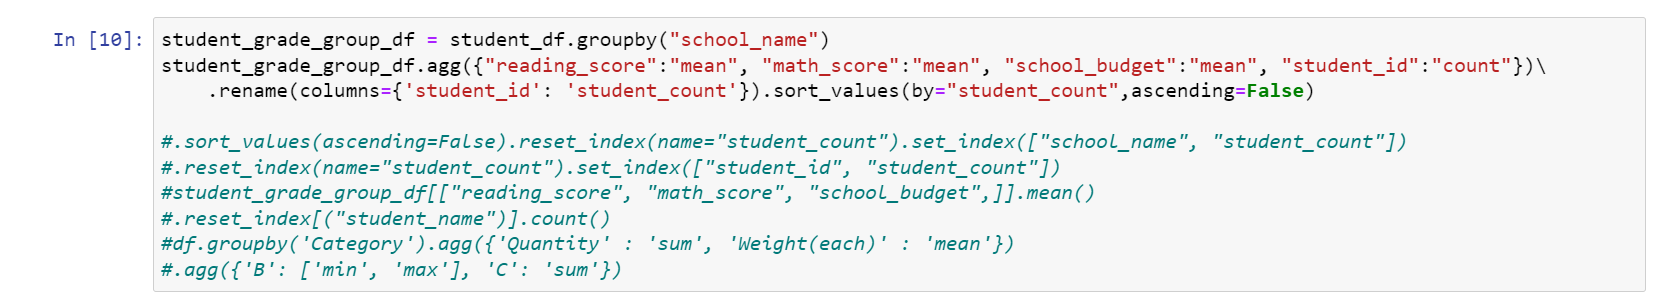
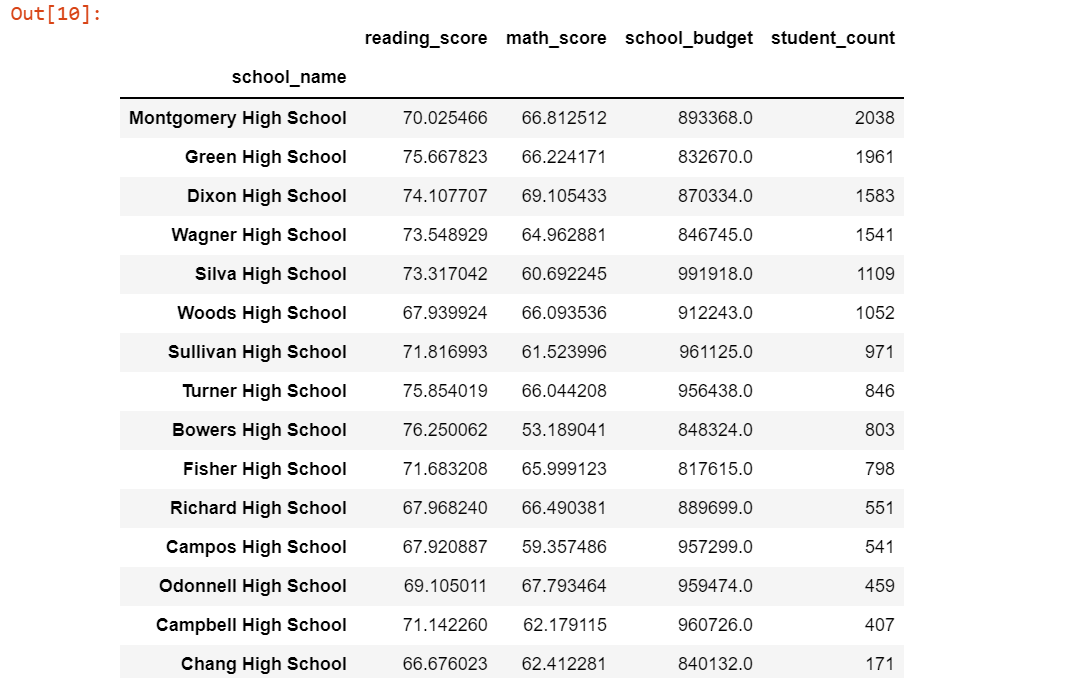
The student and school type data analysis shows comparisons of reading and math scores, school budgets and school student counts. A finding that stood out is the average math score for charter schools decreased from 9th grade to 12th grade by ~10% while public school average math scores remained consistent grade-over-grade. Performing additional analysis on the average reading score by school type and grade shows the charter school average decreased by ~10% from 11th grade to 12th grade while the public school average remained mostly consistent grade-over-grade. There could be many drivers that impact math and reading scores between school types and grades, and from the dataset provided further reasoning could be determined by analysing the impact of school size (student count) and school budget values. Running a groupby on school_name and then aggregating on mean math_score, mean_reading score, school_budget and student_count provides a useful summary to perform a deeper analysis to determine if there are correlations impacting scores. In addition, the dataset provided could be more powerful by including demographics or other external factors for specific school regions in order to better analyze and determine drivers and reasons for fluctuations grade-over-grade within schools as well as comparing charter schools to public schools.
Reading score by-school-type, by-grade:
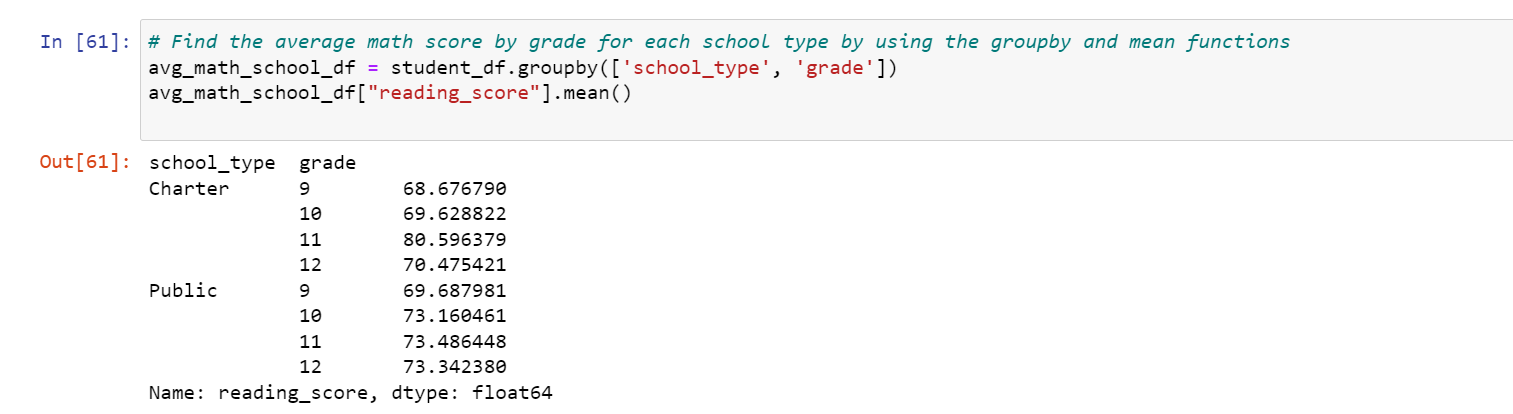
Budget by-school-type, by-school:
Summary by-school of reading scores, math scores, school budget, student count: