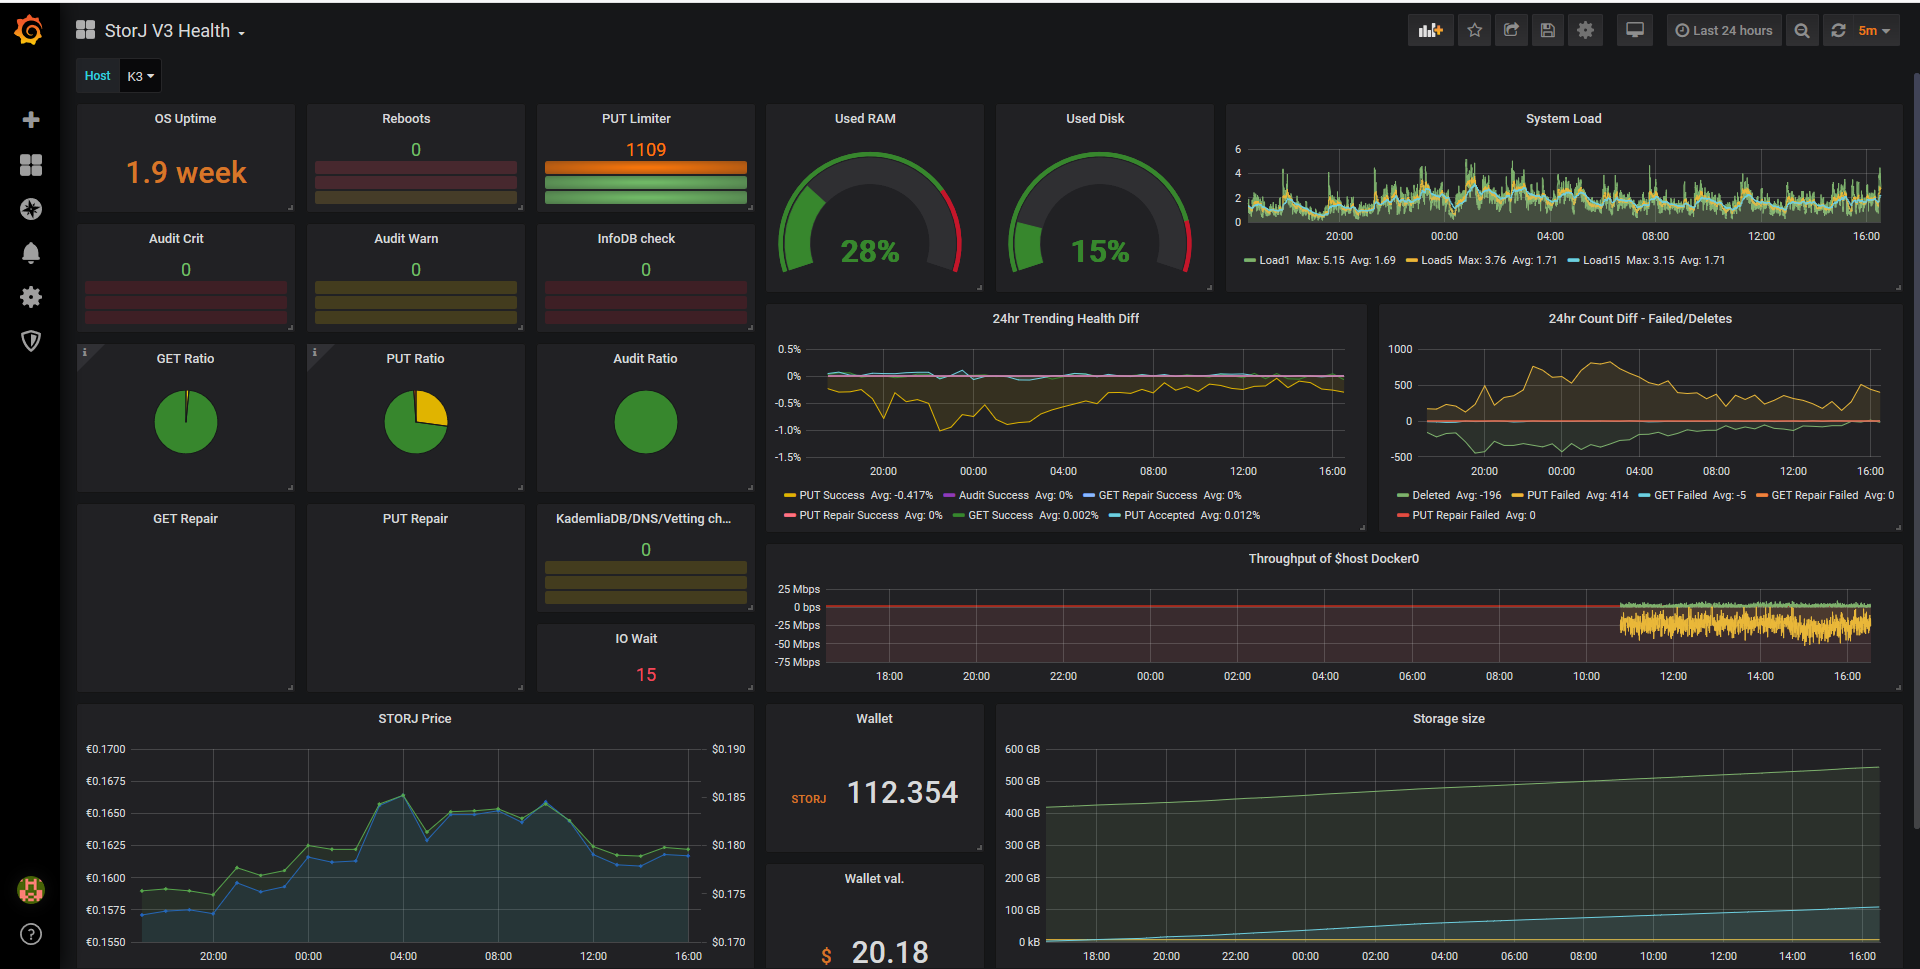
Success Rates output using StorJ logs with telegraf [inputs.exec] to InfluxDB format. Dashboard values extracted from Storage Node API.
Allow telegraf service to access docker for logs (if you are not polling the logfile)
sudo usermod -aG docker telegraf
Open your Storage Node API by adding this:
-p 14002:14002 to your run command of your Storage Node.
Add/Append this block to your telegraf.conf
- StorJ Node Items (default InfluxDB 'StorJ')
 [[inputs.exec]]
   commands = ["/path/to/scripts/successrate.sh" ] #some configs may need "bash " before /
   timeout = "180s" #If you want to run faster than 180s be sure to change this
   interval = "30m" #Comment this out if you already declare it earlier in the config.
   #name_suffix = "_foo" # Will result as "StorjHealth_foo" Uploaded dashboard will not use
   data_format = "influx"

 [[inputs.exec]]
   commands = ["/path/to/scripts/tokens.sh" ] #some configs may need "bash " before /
   timeout = "60s"
   interval = "1h" # if you don't care to track STORJ price, you can increase it to 24h
   data_format = "influx"

  [[inputs.exec]]
     commands = [
          "curl -s 127.0.0.1:14002/api/sno", # Open SNO API by mapping ports when running your SNO docker instance
          "curl -s 127.0.0.1:14003/api/sno" # If multiple nodes, map ports accordingly
          ]
     timeout = "60s"
     interval = "1m"
     data_format = "json"
     tag_keys = [ "nodeID" ]
     name_override = "StorJHealth"
- Host Items
# Read metrics about cpu usage
[[inputs.cpu]]
  ## Whether to report per-cpu stats or not
  percpu = true
  ## Whether to report total system cpu stats or not
  totalcpu = true
  ## If true, collect raw CPU time metrics.
  collect_cpu_time = false
  ## If true, compute and report the sum of all non-idle CPU states.
  report_active = false
[[inputs.disk]]
## By default stats will be gathered for all mount points.
## Set mount_points will restrict the stats to only the specified mount points.
# mount_points = ["/"]

## Ignore mount points by filesystem type.
ignore_fs = ["tmpfs", "devtmpfs", "devfs", "overlay", "aufs", "squashfs"]
[[inputs.diskio]]
 ## IOPS Monitor
[[inputs.mem]]
## RAM Monitor
[[inputs.swap]]
## SWAP Use Monitor
[[inputs.system]]
## Uptime Monitor
[[inputs.net]]
## NIC Traffic Monitor
interfaces = ["docker0"]
In order to track your wallet balance, please create an Eterscan account and API token.
Edit tokens.sh with your wallet address and your Etherscan API token.
Don't forget to chmod +x successrate.sh tokens.sh
It must be allowed to use docker CLI on host machine.
Please add thos arguments when running your Telegraf container:
$PWD=your current path
$PWD_STORJ=your storj data folder path

docker run -d \
    --name telegraf \
    --restart=unless-stopped \
    --net=host \
    -v "$PWD/telegraf.conf:/etc/telegraf/telegraf.conf" \
    -v "$PWD/scripts:/scripts" \
    -v "$PWD_STORJ:$PWD_STORJ:ro" \
    -e HOST_PROC=/host/proc \
    -v /proc:/host/proc:ro \
    -v /var/run/docker.sock:/var/run/docker.sock \
    -v /usr/bin/docker:/usr/bin/docker \
    --security-opt seccomp=unconfined \
    --security-opt apparmor=unconfined \
    telegraf
In order to see if your configuration is OK you can check the inputs.exe are working fine:
- Enter container by running bash:
docker exec -i -t telegraf /bin/bash - Test input plugins:
telegraf --debug --config /etc/telegraf/telegraf.conf --input-filter exec --test
Measurements should output, without warning/error.
Check that metrics are not equal to zero. DLSuccess should have a greater than zero value in the following example line:
StorJHealth,NodeId=123Ngj DLFailed=63,DLSuccess=3257,DLRatio=98.102,PUTFailed=396,PUTSuccess=42998,PUTRatio=99.087,PUTLimit=6501,PUTAcceptRatio=86.866 1564131850213571763
- Telegraf on windows with HyperV NIC:
[[inputs.win_perf_counters]]
  [[inputs.win_perf_counters.object]]
    ObjectName = "Hyper-V Virtual Network Adapter"
    Counters = [
      "Bytes Received/sec",
      "Bytes Sent/sec",
      "Read Bytes/sec"
    ]
    Instances = ["*"]
    Measurement = "Hyper-V_Virtual_Network_Adapter"