-- Project Status: Completed
This project was done for completion of the "Statistical Learning" class at New College of Florida in Fall 2019 (sophomore year). The motivation of this project is to observe and interpret any differences in suicides per 100k by region and several economic indicators. Observing and understanding the effects of the economic status of a country enables us to get a "big picture" view of the mental health around the world and can assist in spreading awareness of mental health and suicides.
- Data Visualization
- Multiple Linear Regression
- Bootstrap Sampling
- R
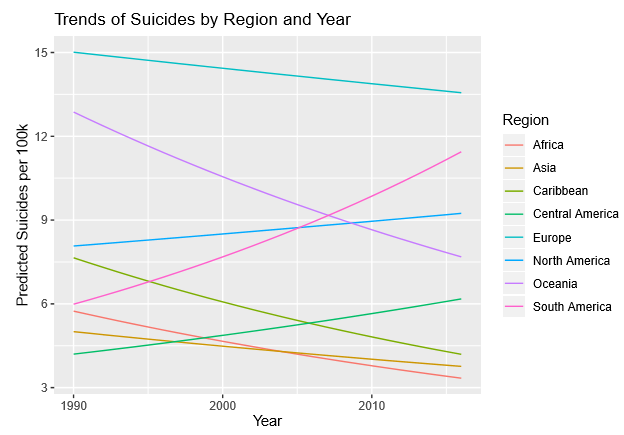
The motivation of this project was to learn more about the trends of suicides around the world and to understand several economic variables that could indicate suicide rates. I looked at region, year, GDP per capita, HDI, and population. At the time, I had not been introduced to time series analysis, so I did not treat year as well as I should have. I was interested in finding any significant interaction between a country's region and GDP per capita having an effect on the suicide rate. By understanding these effects, we can get an overview of what economic variables may indicate a country's suicide rates and can help in spreading awareness of mental health and suicides around the world.
A link to the original data can be found here: Kaggle Dataset
The original dataset contains data on suicides around the world from 1985 to 2015, including several demographic variables for the country observed. Due to the focus of my project, I entirely removed the demographic information and the only seperation of our observations were by country and year. Once the the rows were properly combined, 5.81% of the cells contained missing values. HDI had 69.93% missing values. For this reason, I created a new categorical variable: Development. This places the HDI scale into several levels (low or very low, medium, high, and unknown). I also created a new variable: Region. This just placed each country into one of eight regions of the world.
Additionally, due to the scope of the class, I removed any rows where the observation had 0 suicides. This is because it was negatively affecting my model (and I did not know how to work with what I saw at the time) and no transformations helped. This resulted in 15% of the rows being removed. A zero-inflated Poisson regression model would have been a much more appropriate approach in this case.
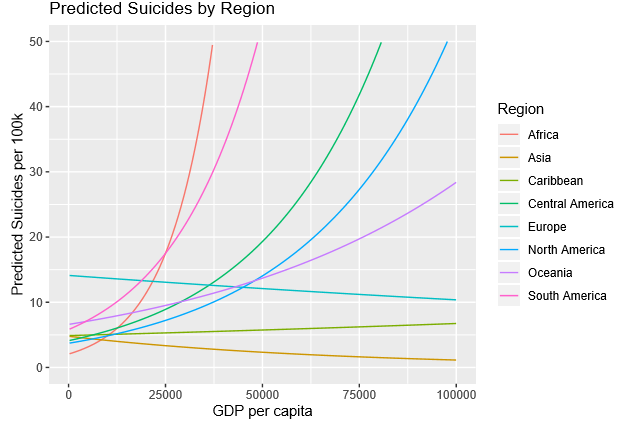
After going through residual diagnostics and mode selection, I found that region, GDP per capita, year, and an intereaction between region and GDP per capita were signficant in predicting a country's suicide rate per 100k population. There was a log transformation on the response and we received an extremely small p-value from our overall F-test. Additionally, the model had an R^2 of 0.2789. See below for the estimates, t-statistics, and p-values for the individual variables:

By holding year constant at 2015, we can visualize the predicted values of our model below: