Implementing click_callback Functionality(Lack of clarity/focused example script) #408
Comments
|
Hi! Your example is not working because k3d.points is not a DrawableWithCallback object Line 181 in 5052d60 So K3D at this moment simply dosen't support callbacks for
callbacks are available for:
It is visible in code execution: I will try to add that to documentation too. |

|
Thank you for the prompt reply! One last query, will callback support be added for the k3d.points object in the near future? |
|
That will be dedicaded mechanism just for points (goal is to calculate ray-sphere intersection rather than ray-mesh). But many people use k3d.points with milions of points so even here I should have some octree... It is not stright forward |
|
Good news! BVH that we use has support for points - https://gkjohnson.github.io/three-mesh-bvh/example/bundle/pointCloudIntersection.html I feel we can do that in k3d soon but I don't want to make a promises :) |
|
btw my benchmark data to points callback- 24m of points (credits: https://sketchfab.com/3d-models/recovering-oak-point-cloud-version-f6dd3f2b081b483bb3f40b6b931016fd )
|

|
Click callback functions #409 Callback "on hover" to python. Green boxes shows BVH Tree [for debug purpose only] on 8 mln of points:
|

Implementing click_callback Functionality(Lack of clarity/focused example script) #408
Description
I was studying the mesh_callback example, linked here. I wanted to implement the click functionality to display metadata about a node when a graph is created, but could not get the on_click functionality to work.
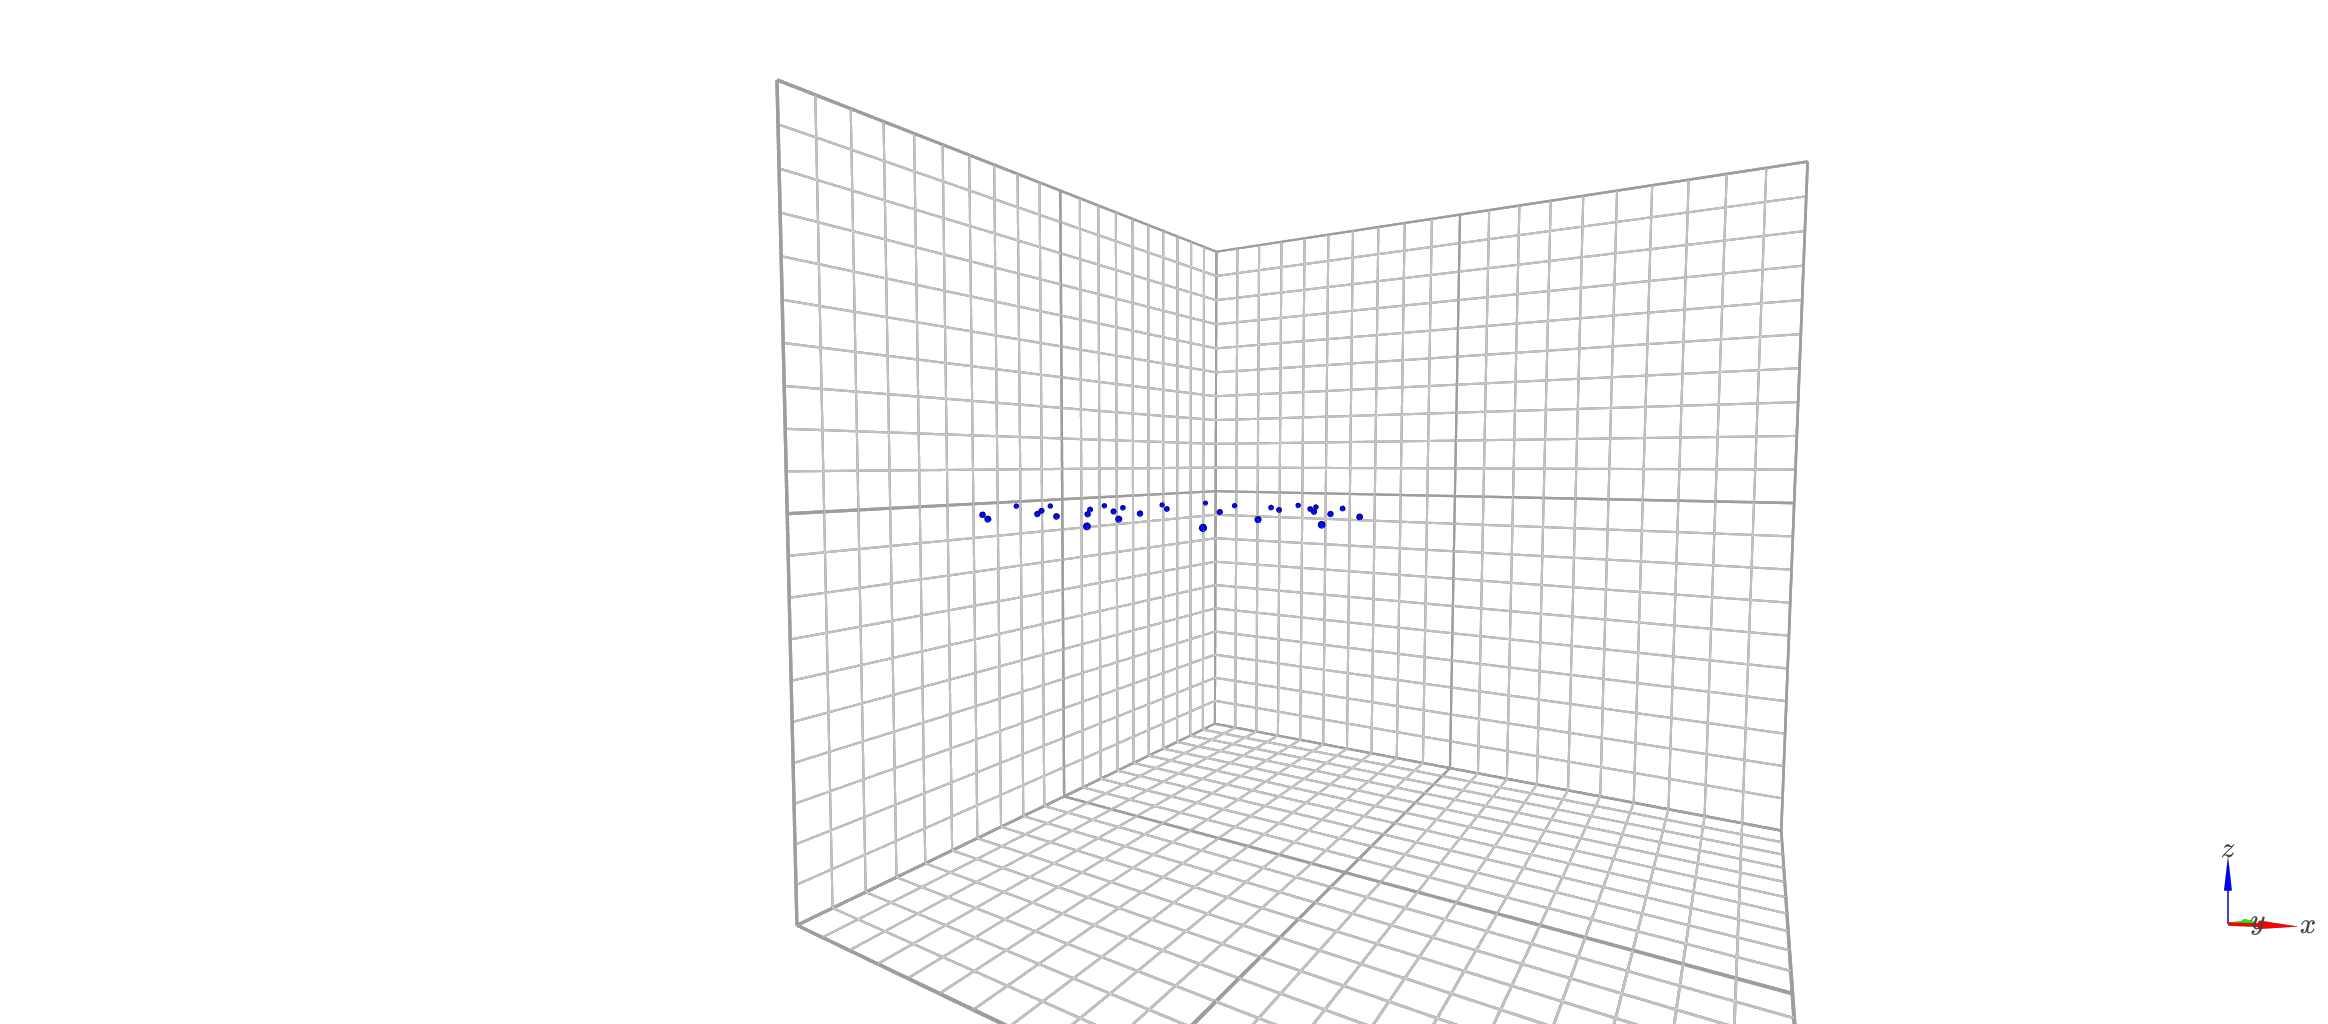
Here is an example graph(Z=0), and what I was trying to do is get some metadata using the on_click callback when a point is clicked.
What I Did
I had a list of points(x,y,0). I converted them into a numpy array. I also had an array with areas for each set of Co-ordinates.
Here is the code I tried.
I understand I must be doing something wrong(my display_area function seems very dodgy). What should I do to get the areas when I click on a point?
(I don't need the points to be exactly the size as their areas denote, they are merely for a graph representation with areas as features)
The text was updated successfully, but these errors were encountered: