SharpPlotter is an application which allows you to quickly draw values onto a graph using C#, Javascript, or Python along with your favorite code editor. When you load up a script in SharpPlotter, every time you save changes the graph will automatically update with the results.
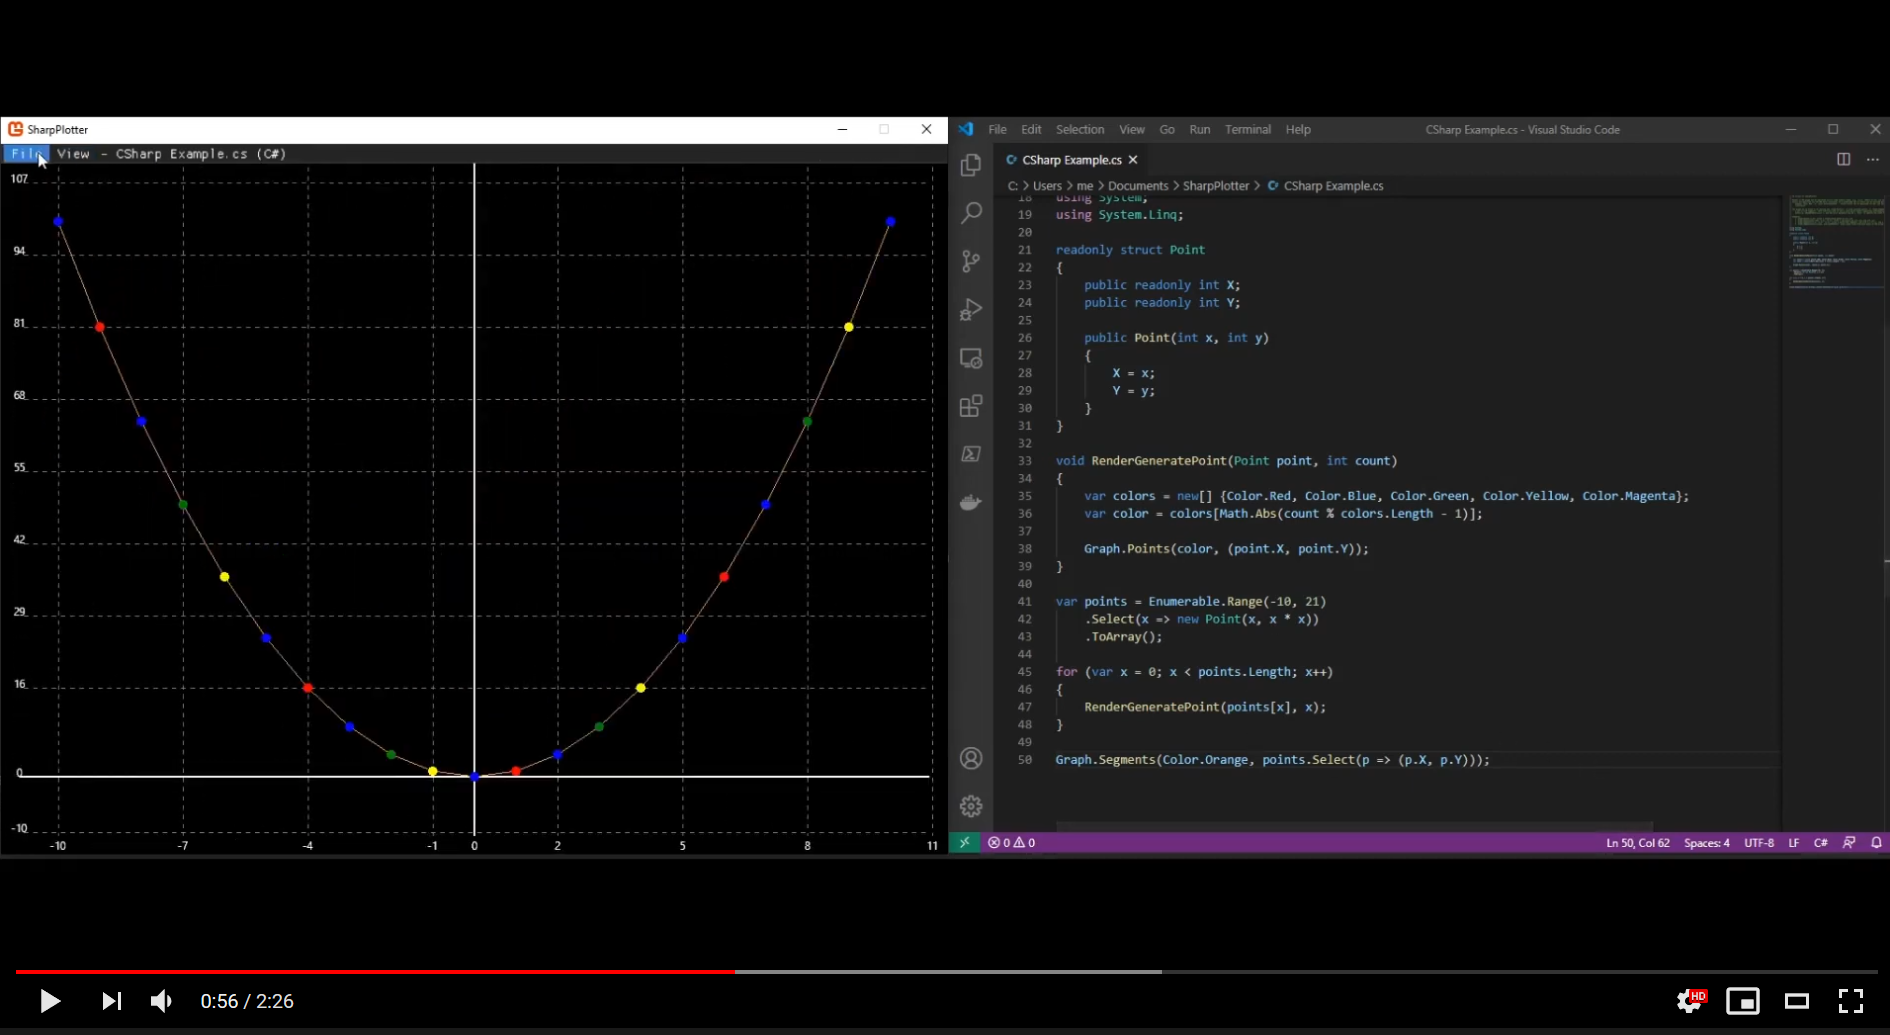
Table of Contents
There are two primary settings that can be changed from within the application, the directory that scripts are located in and what code editor you wish to open automatically (if any).
For simplicity all scripts are restricted to a single directory. By default this directory is %MyDocuments%\SharpPlotter on windows and ~/SharpPlotter on unix variants.
The code editor executable can be changed as well. The default is set to code for visual studio code, but it can be changed to any executable as long as it is in your path. This value can also be emptied if you don't want SharpPlotter to load the text editor for you. When the text editor is launched it will pass in the full path to the script to load as an argument.
Many items that you will want to draw on the graph need one or more coordinates to know where to draw them. These points consist of X and Y coordinates on the graph and are represented differently depending on the scripting language being used:
- C# and Python use tuples with 2 numerical items, such as
(1,2)for x=1, y=2 - Javascript has multiple options for specifying graph coordinates
- As an object literal with an
xandyproperty (e.g.{x: 1, y: 2}) - As an array containing 2 numeric values, with the x value as the first and y value as the 2nd (e.g.
[1,2]) - With a custom built-in function
p()(e.g.p(1,2))
- As an object literal with an
By default all items drawn on the graph will be white. When drawing on the graph it can be useful to set different value sets to different colors to allow for visual differentiation between them.
SharpPlotter scripts have access to the XNA/Monogame Color structure in order to define colors. This can be done by calling the Color(r, g, b) constructor, which takes red, green, and blue values as numeric integers between 0 and 255. The color structure also has many predefined colors that can be readily referenced. Each language can form a color via: new Color(0, 128, 128) or by the predefined values, such as Color.CornflowerBlue.
Scripts are given access to a global object that represents the graph. For C# scripts this is Graph, while Python and Javascript its graph. This object has several methods that can be called to draw on the graph:
Points()- Used to draw one or more isolated points on the graph. Each point will be drawn as a circle centered on the point specified. Any number of points can be passed in, and they can be specified individuall from within the function call, or be passed in via an array of points.Segments()- Used to draw one or more line segments on the graph. Any number of points can be passed in, and a line segment will be drawn from one point to the next in the order specified.Function()- Adds an unbounded function that will be drawn for every visible X graph value on the screen.Arrow()- Creates an arrow from a starting point that points to an ending point. Must have only 2 points passed into it as arguments.Polygon()- Draws a filled in polygon between the specified points. Must have at least 3 points to work.Log()- When passed a single string, this message will be displayed on screen. Multiple calls toLog()can be made for multiple messages. This can be used for debugging or for presenting non-visible data.
All methods (except Log()) can optionally have a Color value specified as the first argument for the color the drawings should be done with. If no color is specified than they will default to white.
Graphs can be animated by defining multiple frames. Each frame consists of it's own distinct set of drawn objects and each frame is its own blank canvas. A new frame can be defined by calling the StartNextFrame() graph method followed by drawing commands that should be run for that frame. All drawing commands called before the first StartNextFrame() will be drawn for the first / initial frame. By default each frame is rendered for one second, but that is changeable by calling SetFrameTime() on the graph and passing in the number of seconds each frame should be rendered for.
As of right now 3 languages are supported - C#, Javascript, and Python. It is important that all script files use the correct language extension (.cs, .js and .py respectively), as that is how SharpPlotter knows which scripting engine to use for each file.
SharpPlotter uses the Rosly for C# 8 compiling and execution. Scripts being written do not need to apply to a lot of formalities of most C# projects, meaning that the code does not need to be enclosed in a namespace or class, and class/struct definitions, function definitions, and execution code can all exist on the same indentation levels.
Standard C# lambdas can be used to draw unbounded functions. These lambadas must take in a float and return a float, for example Graph.Function(x => x * x);
An example script is:
using System;
using System.Linq;

readonly struct Point
{
    public readonly int X;
    public readonly int Y;

    public Point(int x, int y)
    {
        X = x;
        Y = y;
    }
}

void RenderGeneratePoint(Point point, int count)
{
    var colors = new[] {Color.Red, Color.Blue, Color.Green, Color.Yellow, Color.Magenta};
    var color = colors[Math.Abs(count % colors.Length - 1)];

    Graph.Points(color, (point.X, point.Y));
}

var points = Enumerable.Range(-10, 21)
    .Select(x => new Point(x, x * x))
    .ToArray();

for (var x = 0; x < points.Length; x++)
{
    RenderGeneratePoint(points[x], x);
}

Graph.Segments(Color.Orange, points.Select(p => (p.X, p.Y)));


This is generated by the following script:
using System;
using System.Linq;

readonly struct Vector3 {
    public readonly float X, Y, Z;

    public Vector3(float x, float y, float z) => (X, Y, Z) = (x, y, z);

    public static implicit operator Vector3((float x, float y, float z) v) => new Vector3(v.x, v.y, v.z);
    public static Vector3 operator-(Vector3 first, Vector3 second) => new Vector3(first.X - second.X, first.Y - second.Y, first.Z - second.Z);
    public static Vector3 operator+(Vector3 first, Vector3 second) => new Vector3(first.X + second.X, first.Y + second.Y, first.Z + second.Z);
    public static Vector3 operator*(Vector3 vec, float scalar) => new Vector3(vec.X * scalar, vec.Y * scalar, vec.Z * scalar);

    public (float x, float y) ToGraphPoint() => (X, Y);
    public float Length => (float) Math.Sqrt(X * X + Y * Y + Z * Z);
    public float Dot(Vector3 other) => (X * other.X) + (Y * other.Y) + (Z * other.Z);
    public Vector3 Unit => this * (1 / this.Length);

    public Vector3 Cross(Vector3 other) {
        var x = Y * other.Z - Z * other.Y;
        var y = Z * other.X - X * other.Z;
        var z = X * other.Y - Y * other.X;
        return (new Vector3(x, y, z));
    }

    public Vector3 ProjectTo2d(Camera camera) {
        var x = this.Dot(camera.Right) / camera.Right.Length;
        var y = this.Dot(camera.Up) / camera.Up.Length;
        return (x, y, 0);
    }

    public Vector3 RotateOnZ(int degrees) {
        var rotationRadians = degrees * Math.PI / 180f;
        var currentRotation = Math.Atan2(Y, X);
        var length = (float) Math.Sqrt(X*X + Y*Y);
        var newRotation = currentRotation + rotationRadians;
        var x = (float) Math.Cos(newRotation) * length;
        var y = (float) Math.Sin(newRotation) * length;
        return (x, y, Z);
    }

    public Vector3 RotateOnY(int degrees) {
        var rotationRadians = degrees * Math.PI / 180f;
        var currentRotation = Math.Atan2(Z, X);
        var length = (float) Math.Sqrt(X*X + Z*Z);
        var newRotation = currentRotation + rotationRadians;
        var x = (float) Math.Cos(newRotation) * length;
        var z = (float) Math.Sin(newRotation) * length;
        return (x, Y, z);
    }

    public Vector3 RotateOnX(int degrees) {
        var rotationRadians = degrees * Math.PI / 180f;
        var currentRotation = Math.Atan2(Y, Z);
        var length = (float) Math.Sqrt(Z*Z + Y*Y);
        var newRotation = currentRotation + rotationRadians;
        var z = (float) Math.Cos(newRotation) * length;
        var y = (float) Math.Sin(newRotation) * length;
        return (X, y, z);
    }

    public override string ToString() => $"{{X={X}, Y={Y}, Z={Z}}}";
}

readonly struct Triangle {
    public readonly Vector3 V1, V2, V3;

    public Triangle(Vector3 v1, Vector3 v2, Vector3 v3) => (V1, V2, V3) = (v1, v2, v3);
    public Vector3 Normal => (V2 - V1).Cross(V3 - V1);
}

class Camera {
    public Vector3 Up, Right;

    public Camera() {
        Up = (0, 1, 0);
        Right = (1, 0, 0);
    }
}

var camera = new Camera();
var octehedron = new[] {
    new Triangle((1, 0, 0), (0, 1, 0), (0, 0, 1)),
    new Triangle((1, 0, 0), (0, 0, -1), (0, 1, 0)),
    new Triangle((1, 0, 0), (0, 0, 1), (0, -1, 0)),
    new Triangle((1, 0, 0), (0, -1, 0), (0, 0, -1)),
    new Triangle((-1, 0, 0), (0, 0, 1), (0, 1, 0)),
    new Triangle((-1, 0, 0), (0, 1, 0), (0, 0, -1)),
    new Triangle((-1, 0, 0), (0, -1, 0), (0, 0, 1)),
    new Triangle((-1, 0, 0), (0, 0, -1), (0, -1, 0)),
};

var zRotation = 0;
var yRotation = 0;
var xRotation = 0;
var light = new Vector3(1, 0, 3);
var lightUnitVector = light.Unit;

Graph.SetFrameTime(0.125);
for (var i = 0; i < 360 / 5; i++) {
    if (i != 0) Graph.StartNextFrame();

    var rotatedOctehedron = octehedron
        .Select(x => new Triangle(x.V1.RotateOnZ(zRotation), x.V2.RotateOnZ(zRotation), x.V3.RotateOnZ(zRotation)))
        .Select(x => new Triangle(x.V1.RotateOnY(yRotation), x.V2.RotateOnY(yRotation), x.V3.RotateOnY(yRotation)))
        .Select(x => new Triangle(x.V1.RotateOnX(xRotation), x.V2.RotateOnX(xRotation), x.V3.RotateOnX(xRotation)))
        .ToArray();

    foreach (var triangle in rotatedOctehedron) {
        var projectedTriangle = new Triangle(triangle.V1.ProjectTo2d(camera),
            triangle.V2.ProjectTo2d(camera),
            triangle.V3.ProjectTo2d(camera));

        var normal = triangle.Normal.Unit;

        var alignment = lightUnitVector.Dot(normal);

        if (normal.Z > 0) {
            if (alignment < 0) {
                alignment = 0;
            }

            var color = new Color(alignment, alignment, alignment);

            Graph.Polygon(color,
                projectedTriangle.V1.ToGraphPoint(),
                projectedTriangle.V2.ToGraphPoint(),
                projectedTriangle.V3.ToGraphPoint());
        }
    }

    yRotation += 5;
    xRotation += 5;
}
SharpPlotter uses a full ECMA 5.1 compliance compiler and execution engine for its javascript support.
Unbounded functions can be graphed in by passing a function that takes a single numeric argument and returns a numeric argument. E.g. graph.Function(function(x) {return x * x;}).
An example script is:
function renderPoint(point) {
    var allColors = [Color.Red, Color.Yellow, Color.Blue, Color.Magenta, Color.Cyan];
    var index = Math.abs(point.x + point.y) % allColors.length;
    var chosenColor = allColors[index];

    graph.Points(chosenColor, point);
}

var points = Array(9).fill().map((_, i) => ({x: i, y: i * i}));
var inversePoints = points.map(p => ({x: -p.x, y: -p.y}));

points.forEach(renderPoint);
inversePoints.forEach(renderPoint);
graph.Segments(Color.Green, points);
graph.Segments(Color.Red, inversePoints);

SharpPlotter contains a Python 2.7 compatible python interpretor.
Unbounded functions can be graphed by passing a python lambda into the graph.Function function call. These lambads must take in a single numeric value and return a numeric value. E.g. graph.Function(lambda x: x * x).
An example script is:
def renderPoints(point):
    allColors = [Color.Red, Color.Yellow, Color.Blue, Color.Magenta, Color.Cyan]
    index = abs(point[0] + point[1]) % len(allColors)
    chosenColor = allColors[index]

    graph.Points(chosenColor, point)

points = []
for x in range(8):
    points.append((x, x * x))

for point in points:
    renderPoints(point)

graph.Segments(Color.Blue, points)
