This module was aimed at a specific experiment run at Prof. Dino Levy's lab in Tel-Aviv University. As such, it expects to recieve a specific file format and will produce an EEG analysis based random forest model for predicting a subject's preference to given commercials and the effect of commercials on a subject's response to given items.
for brief overview of the data structure the Jupyter notebook "initial_data_visualisation.ipynb" can be used.
File Description: the module accepts ONLY .mat files that contain the specific fields specified below, it is designed to work with additional datasets only in the original format.
note: The .mat file can be imported into python by the "mat73" module, for closer inspection prior to this pipline use Matlab (The input is parsed throught the pipline and can be inspected closely there as well).
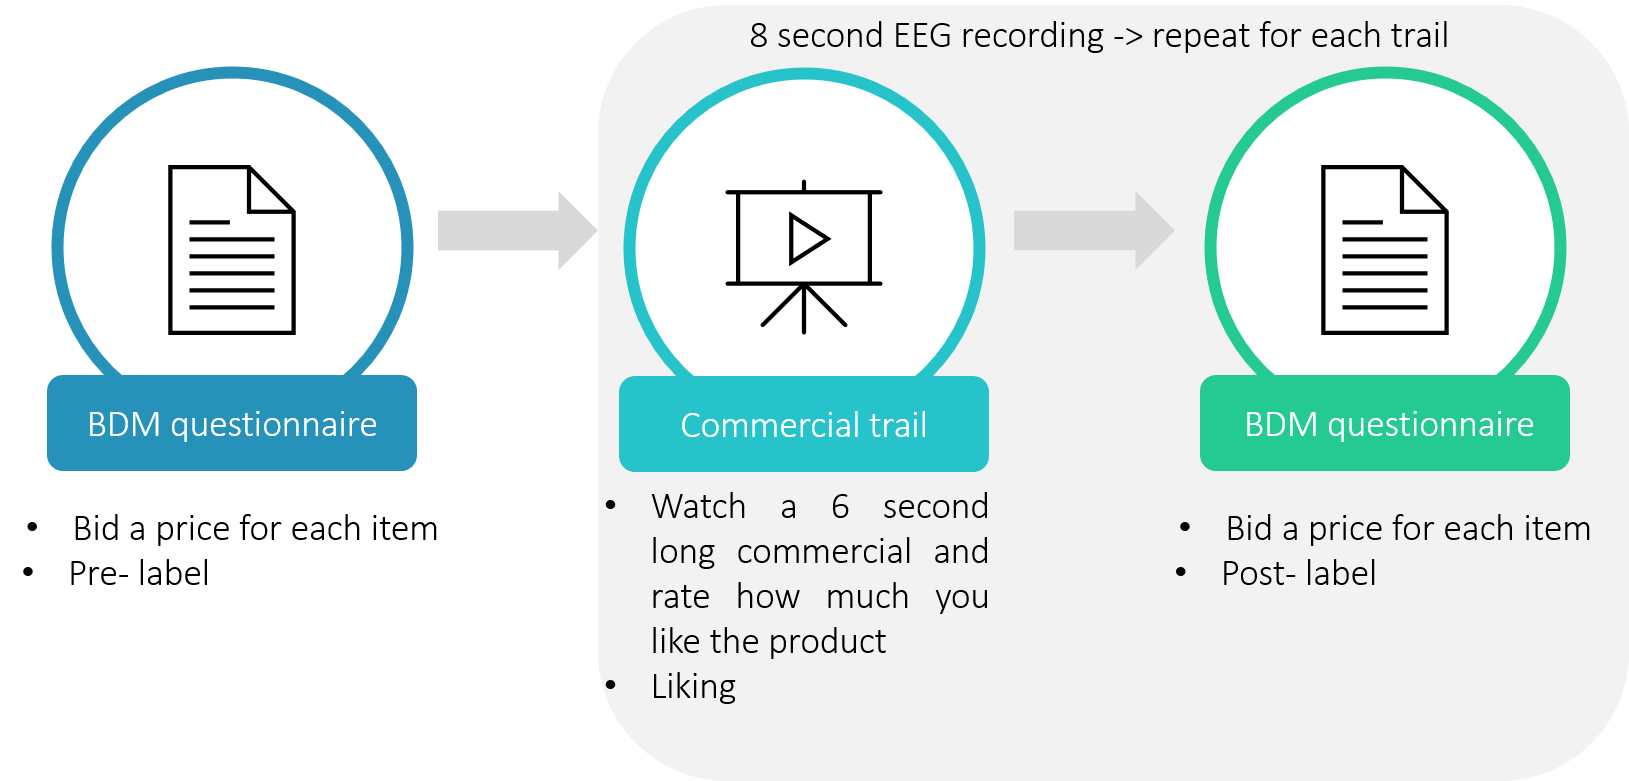
Primary Fields: • SubID: the identifier of the subject whose data is in the same row. • BDMEEG: data related to the BDM phase of the experiment, for the subject in the row. • AdEEG: data related to the Advertisements phase of the experiment, for the subject in the row. • Triggers: a time series containing all the triggers presents throughout the experiment for the subject. You will likely not require this.
Secondary Structs: AllEEG().BDMEEG: Once you access this field, you will find another struct variable nested within it. Here, each row represents a different trial of a given subject from the BDM phase. The fields of this struct are:
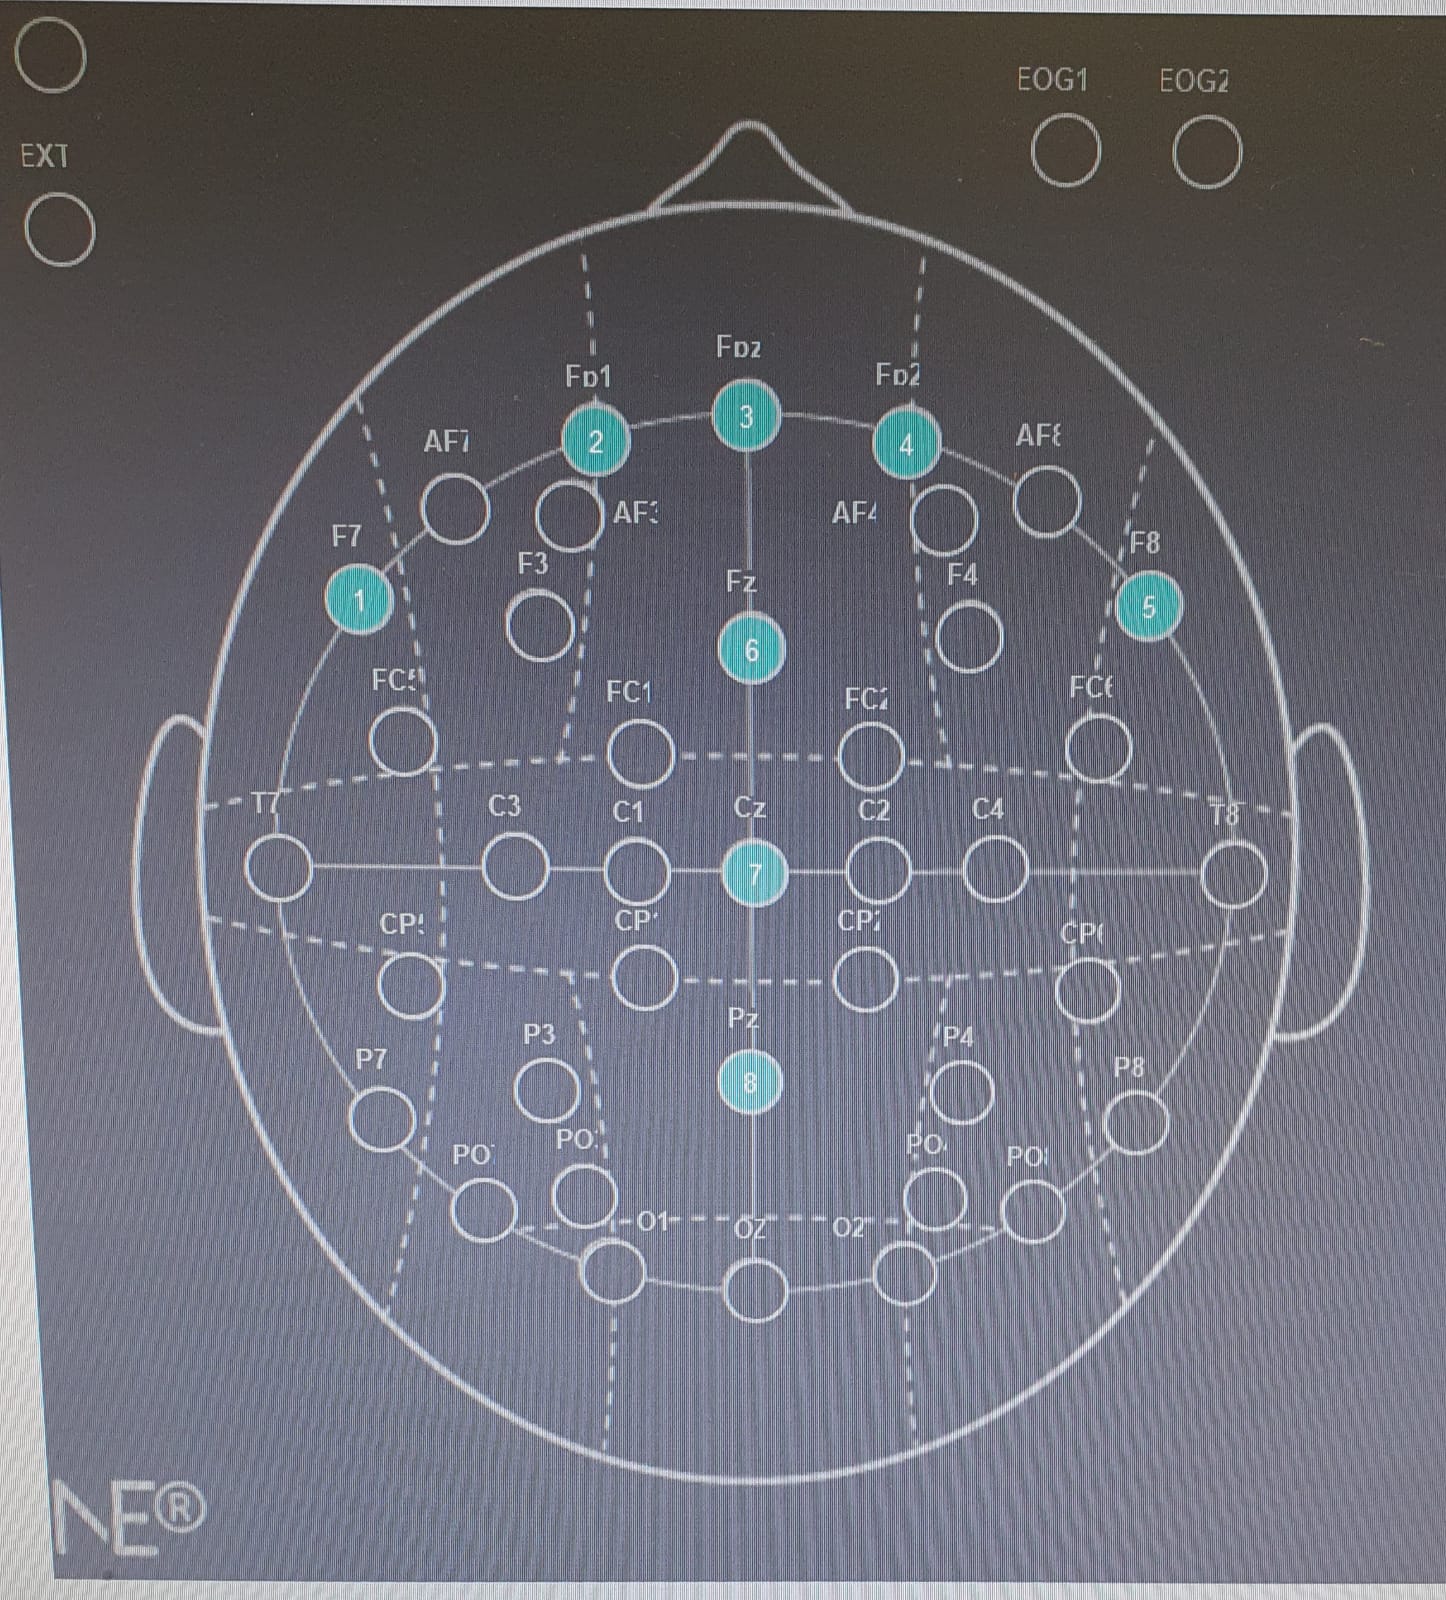
- EEG: a matrix (double) containing the EEG recordings from 8 electrodes (rows) throughout 4.5 seconds sampled at 500 Hz (columns). The first second is an ITI (“baseline”), and the following 3.5 seconds are viewing of the product’s image.
- Category: Category of the product viewed in the trial.
- Item: Name of the item viewed in the trial.
- Repetition: The number of appearances of the same product.
- Label: The value given to the product on that trial, from 0 to 100.
- nArtifacts: the number of faulty electrodes found in the trial (0 to 8), by an automatic artifact detection pipeline.
AllEEG().AdEEG: In this field you will find another struct variable nested within it. Each row in the nested struct represents a different trial of a given subject from the Ads phase. The fields are:
- EEG: A matrix (double) containing the EEG recordings from 8 electrodes (rows) throughout 7 seconds sampled at 500 Hz (columns). The first second is an ITI, and the following 6 seconds are viewing of the product’s commercial. Note that each product has several different commercials, that each is viewed once.
- Category: Category of the product viewed in the trial.
- Item: Name of the item viewed in the trial.
- Repetition: The number of appearances of different commercials for the same product.
- AdID: The Identifier of the ad. This is also mentioned in the “Products.xlsx” file, which can be related to an actual commercial in the video ads folder.
- ItemID: The identifier of the item.
- Label: The value given to the product on that trial, from 0 to 100.
- Liking: The value given to the commercial that appeared on that trial, from 0 to 7.
- nArtifacts: the number of faulty electrodes found in the trial, by an automatic artifact detection pipeline.
neegpdr offers two modes of analysis via two different models:
- Liking Model: this model predicts whether or not a subject will like a certain commercial based on EEG recording.
- Diff Model: this model predicts how will watching a commercial effect the amount a subject is willing to pay for a specific item.
note: due to python indexing the electrode indexing starts at 0 in the pipeline